
Applied Fitness Testing: An Introduction

Body Composition
Muscular Strength
Blood Pressure & Heart Rate
Muscular Endurance
Lab & Field Tests
Flexibility
Aerobic Fitness
Muscular Power
Why Fitness Testing?
Introduction
This page aims to provide coaches and sports performers with a general insight into the role of fitness testing and how it may help them in their sport. It will also address some of the issues regarding what to be aware of when undertaking a fitness test and how to utilise the results. However, it is acknowledged that success in sport is not solely built upon physical fitness, but also requires good technical ability, mental skills and attitudes, all of which must be trained to meet the demands of the sport.
Why fitness test
Performance in any sporting event is the result of a multitude of factors, which include the amount of training performed, the body’s adaptation to the training, motivation level, nutritional status and weather conditions to name a few. As you can acknowledge, physiological parameters only account for a portion of any performance, and so the role of any exercise physiologist is also similarly limited.
Through fitness testing, the factors involving physiological processes, over which there is some control, can be measured and ultimately improved upon. Performance in any sporting event is the result of a multitude of factors, which include the amount of training performed, the body’s adaptation to the training, motivation level, nutritional status and weather conditions to name a few. As you can see, physiological parameters only account for a portion of any performance, and so the role of any exercise physiologist is also similarly limited. Through fitness testing, the factors involving physiological processes, over which there is some control, can be measured and ultimately improved upon.
Benefits of fitness testing
Of the many benefits of fitness testing, the major use is to establish the strengths and weaknesses of the athlete. This is done by comparing test results to other athletes in the same training group, the same sport, or a similar population group. Previous test results of large groups are often published as normative tables. By comparing results to successful athletes in your sport, you can see the areas which need improvement, and the training programme can be modified accordingly. This way valuable training time can be used more efficiently. However, beware that some athletes perform well in their sport despite their physical or physiological attributes, and it may not be advantageous to be like them.
How can fitness testing help you?
Whether you are a coach or participant at a sports club or international level, in whatever sport, fitness testing can almost certainly help your performance. The potential uses and benefits of fitness testing are the following. Evaluation of a performer’s strengths and weaknesses, relative to the demands of their sport.
-
Aiding the prescription of suitable training loads.
-
Monitoring the effectiveness of training.
-
Providing short-term fitness goals.
What makes a good fitness test?
To provide useful information, fitness tests must fulfil certain criteria, which if not achieved could produce misleading information with undesirable consequences. Therefore fitness tests must be:
-
Sport-specific/applicable
-
Valid
-
Reliable
-
Accurate
-
Sufficiently sensitive to detect changes in fitness
Test specific
To be relevant to a sport, a fitness test must mimic one or a combination of the fitness demands
of that sport. For example, a treadmill would be used to assess a runner’s fitness, while a cycle ergometer would be used for a cyclist. Tests devised to assess team game sports performers should incorporate the types of movements and distances involved in that sport (e.g. shuttle running). Whereas sports performers that utilise specific equipment may be required to wear.
Test validity
To be valid, a test must assess what it is intending to. For example, whilst completing as many press-ups as possible may be a good measure of muscular endurance, it is not a valid measure of maximal strength. Likewise, if a test lacks sport specificity it is unlikely to be a valid test for that particular sport. Poor validity may also arise if other factors have the potential to mask what is being assessed. For example, if assessing sprinting speed in hockey, it would be inappropriate to require the player to dribble a ball, as this would assess dribbling speed not sprinting speed.
Test reliability
Reliability refers to how repeatable and consistent a test is. Ideally, if a performer repeated a test under the same conditions with no change in their fitness they should produce identical results. However, in reality, obtaining the same results are most unlikely due to slight differences by the performer from one day to the next. Coaches and performers should be aware that a relatively small change in the test scores may not mean a change in fitness.
Test accuracy
The test accuracy is incorporated into the test validity and reliability and covers the accuracy to which measurements can be recorded. For example, a highly skilled coach may be able to hand time with an accuracy of +/- 0.1 seconds, but would not be able to accurately record to +/- 0.01 seconds.
Test sensitivity
A test must be sufficiently sensitive to detect changes in fitness or else hard-earned fitness gains could go undetected, which may severely de-motivate the performer and undermine the credibility of the coach. A test’s sensitivity will depend upon its reliability and measurement accuracy.
Types of fitness tests
Physical fitness is a complex, multifaceted phenomenon, composed of:
-
Aerobic power
-
Anaerobic power and anaerobic capacity
-
Muscular endurance
-
Muscular strength
-
Flexibility and joint mobility
-
Speed
For effective fitness testing, the coach and performer need to identify the fitness components, which contribute to performing their sport, then select and administer an appropriate series of tests. For team and racquet sports, due to their complexity, this may require a detailed analysis of the sport. Since each sport differs from the fitness components necessary, so the fitness tests used are also likely to differ.

Body Composition

It is well recognised and documented that excessive body fat, particularly when sited centrally around the abdomen, is associated with hypertension, metabolic syndrome, Type 2 diabetes mellitus, stroke, cardiovascular disease), and dyslipidaemia. The Health Survey for England (2017) estimates that 28.7% of adults in England are obese and a further 35.6% are overweight. Obesity is generally defined as having a body mass index (BMI) of 30 or above. BMI between 25 and 30 is classified as ‘overweight’. The survey found that men are more likely than women to be overweight or obese (67.2% of men, 61.5% of women). Individuals aged between 65-74 are most likely to be overweight or obese. Unfortunately, the prevalence of obesity has progressively increased over the last three decades. More troubling are the statistics relating to children that estimates that 9.5% of children aged 4-5 are obese, with a further 12.8% overweight. At age 10-11, 20.1% are obese and 14.2% overweight. Children living in deprived areas in England are more likely to be obese. At age 4-5, 6.4% of those in the least deprived areas are obese, compared with 12.4% of those in the most deprived areas. At age 10-11, 13.3% of children in the least deprived areas are obese, compared with 26.7% in the most deprived areas. This gap has again increased over the last decade.
Essentially body composition can be expressed as the relative percentage of body mass that is fat and fat-free tissue using a two-compartment model. Body composition can be assessed with laboratory and field techniques that vary in terms of difficulty, cost, and accuracy (Duren et al., 2008 [Link]; Lee and Gallagher, 2008 [Link]). It is important to note that prior to collecting any data for body composition assessors or technicians must be trained and experienced in the applied techniques. This may be via under the direct supervision initially of a qualified mentor in a controlled testing environment. In this section, different assessment techniques are summarised. It is beyond the scope of this section to provide information on every measurement and calculation estimate of body composition, body fat and fat three mass.
Anthropometrics Methods
Body Mass Index
BMI is easy to measure and calculate and is, therefore, the most frequently used tool to correlate the risk of health problems with the weight at the population level. It was originally developed by Adolphe Quetelet during the 19th century (termed Quetelet index [Eknoyan, 2007 [Link]). During the 1970s and based especially on the data and report from the Seven Countries Study (Keys et al. 1984 [Link], researchers noticed that BMI appeared to be a good proxy for adiposity and overweight related problems.
BMI formerly known as the Quetelet index is used to measure weight relative to height and is calculated by dividing body weight in kilograms by height in meters squared. For example, an adult who weighs 70 kg and whose height is 1.75 m will have a BMI of 22.9.
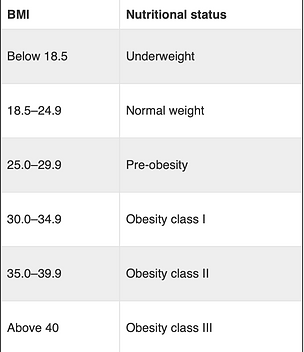
For most individuals, obesity-related health problems increase beyond a BMI of 25.0 kg.m-2. For adults that are overweight the BMI has been defined as 25.0-29.9 kg.m-2 and for obese individuals a BMI of ≥ 30.0 kg.m-2 (Table 1). Unfortunately, BMI fails to differentiate between body fat, muscle mass, or bone. However, an increased risk of hypertension, sleep apnea, Type 2 diabetes mellitus, certain cancers, CVD, and mortality is associated with a BMI ≥ 30.0 kg.m-2. When compared to individuals classified as obese, the association between a BMI of 25.0–29.9 kg.m-2) and higher mortality risk is uncertain. However, a BMI of 25.0–29.9 kg.m-2 is related to an increased risk of developing Type 2 diabetes mellitus, dyslipidaemia, hypertension, and certain cancers. A BMI of < 18.5 kg.m-2 also increases mortality risk and is accountable for the lower portion of the J-shaped curve when plotting risk on the y-axis and BMI on the x-axis (Flegal et al., 2005 [Link]). The use of specific BMI values to predict per cent body fat and health risk (Gallagher et al., 2000 [Link]). Because of the relatively large standard error of estimating per cent body fat from BMI, other methods of body composition assessment should be applied to assess per cent body fat during a physical fitness assessment.

Table 1. Nutrition Status For adults over 20 years old
Body circumference measurements

Measuring individuals body circumference
The distribution of body fat distribution is acknowledged as an important indicator of health (de Koning et al. 2007 [Link]). Android obesity (i.e. the excessive distribution of abdominal fat on the midsection) increases the risk of hypertension, metabolic syndrome, Type 2 diabetes mellitus, dyslipidaemia, CVD, and premature death compared with individuals who have more gynoid distributions (i.e., fat distribution on the hips and thighs) (Pi-Sunyer, 2004 [Link]). Furthermore, individuals who have increased abdominal fat are associated with a higher risk of developing metabolic syndrome.
Circumference (or limb girth) measurements may be applied to provide a general depiction of the individual’s body composition. This will be then assessed based on specific equations for both genders and age ranges (Tran and Weltman, 1988 [Link]; Tran and Weltman, 1988 [Link]). The accuracy is within the 2.5%–4.0% range of the ‘real’ body composition if the client has similar characteristics to the original comparable population and the circumference measurements are accurate. A cloth tape measure with a spring-loaded handle is traditionally used to reduce skin compression and improve the reliability of measurement. Additional measurements are suggested at each site and should be obtained in a rotational order of all sites being assessed. The average of the two measures is used if they do not oscillate by more than 5 mm. Below contains the common measurement sites used to measure circumferences:
-
Abdomen
-
Arm
-
Buttock/ hips
-
Calf
-
Forearm
-
Hips/thigh
-
Mid-thigh
-
Waist
Waist-to-Hip Ratio
The waist-to-hip ratio (WHR) is the circumference of the waist (above the iliac crest) divided by the circumference of the hips and has traditionally been used as a simple method for assessing body fat distribution and identifying individuals with higher and more detrimental amounts of abdominal fat (Xavier and Pi-Sunyer, 2004 [Link]). Health risk increases as WHR proliferates, and this varies with age and sex. For example, Morris et al. (1993) produced a nomograph based on maximal exercise capacity and age for assessing a patients ability to perform a dynamic exercise to quantify the level of physical disability or relative capacity for physical activity. Based on the nomograph health risk is very high for young men when WHR is 0.95 and for young women when WHR is 0.86. Whereas individuals aged 60–69 years have a WHR cut-off value of >1.03 for men and >0.90 for women for the same high-risk classification as young adults (Morris et al. 1993 [Link]). Several methods for waist circumference measurement involving different anatomical sites are available. Evidence indicates that all currently available waist circumference measurement techniques are equally reliable and effective in identifying individuals at increased health risk (Ross et al. 2020 [Link])
Table 2. Risk Criteria for Waist Circumference in Adults

Adapted from Alberti, Zimmet and Shaw (2006 [Link])
Supporting articles on body composition
-
Alberti, K.G.M.M., Zimmet, P. and Shaw, J., 2006. Metabolic syndrome—a new world‐wide definition. A consensus statement from the international diabetes federation. Diabetic medicine, 23(5), pp.469-480
-
Tran, Z.V. and Weltman, A. (1989) Generalized equation for predicting body density of women from girth measurements. Med Sci Sports Exerc, 21(1), pp.101-104.
-
Tran, Z.V. and Weltman, A., 1988. Predicting body composition of men from girth measurements. Human biology, pp.167-175.
-
Pi-Sunyer, F.X., 2004. The epidemiology of central fat distribution in relation to disease. Nutrition reviews, 62(suppl_2), pp.S120-S126.
-
Morris, C.K., Myers, J., Froelicher, V.F., Kawaguchi, T., Ueshima, K. and Hideg, A., 1993. Nomogram based on metabolic equivalents and age for assessing aerobic exercise capacity in men. Journal of the American College of Cardiology, 22(1), pp.175-182.
-
Ross, R., Neeland, I.J., Yamashita, S., Shai, I., Seidell, J., Magni, P., Santos, R.D., Arsenault, B., Cuevas, A., Hu, F.B. and Griffin, B.A., 2020. Waist circumference as a vital sign in clinical practice: a Consensus Statement from the IAS and ICCR Working Group on Visceral Obesity. Nature Reviews Endocrinology, pp.1-13.
Skinfold Measurements
Skinfold measurement is a procedure that estimates how much fat is on the body. It involves using a device called a calliper to lightly squeeze the skin and underlying fat in several sites. Body composition determined from skinfold thickness measurements correlates well (r = 0.70–0.90) with body composition determined by hydrodensitometry. The rationale behind skinfold measurements is that the amount of subcutaneous fat is proportional to the total amount of body fat. It is assumed that up to one-third of the individuals total fat is located subcutaneously. The proportion of subcutaneous to total fat according to Roche, (1996) varies with sex, age, and race. Therefore, regression equations used to convert sum of skinfolds to per cent body fat should consider these variables to enhance test validity.
Table 3. Description of skinfold sites and procedures

Adapted from ACSM (2014) Guidelines for Exercise Testing.
Skinfold assessment of body composition is highly dependent on the knowledge of the assessor, so knowledge of anatomical landmarks and practice of the technique is required to attain precise measurements. The accuracy of calculating per cent body fat from skinfolds is approximately 3.5%, assuming appropriate techniques and equations have been applied (Heyward and Wagner, 1996). Considerations that may lead to measurement error within skinfold assessment include poor technique and/or an inexperienced assessor, an exceedingly obese or particularly lean individual, and an improperly attuned calliper (Heyward, 1998 [Link]).
Various regression equations have been established to predict body density or per cent body fat from skinfold measurements (Table 4 and 5). A list of common equations that allow calculation of body density without a loss in prediction accuracy for a wide range of individuals (Heyward, 1998 [Link]; Jackson et al.1998 [Link]). Other equations have been published that are sex, age, race, fat, and sport specific.
Additional Digital Resources
Credit: ACEFitness How to Find Your Waist to Hip Ratio
Credit: La Tech: Seven site skinfold measurement
Table 4. Male skinfold equations

Table 5. Female skinfold equations

Table 4 and 5. Adapted ffrom Jackson and Pollock (1985) [Link]
Densitometry
Body composition can be assessed from the measurement of an individuals whole-body density using the ratio of body mass to body volume. Densitometry has been frequently used as a criterion standard for evaluating body composition for several years. However, the restrictive issue in the measurement of body density is the accuracy of the body volume measurement as body mass is assessed as body weight. Body volume can be measured by hydrodensitometry (underwater) weighing and by plethysmography.
Hydrodensitometry (Underwater) and Plethysmography Weighing
This method of evaluating body composition is founded on Archimedes’ principle that states when a body is immersed in water, it is buoyed by a counterforce equal to the weight of the water displaced (ACSM, 2014). This loss of weight in water allows for the computation of body volume. Bone and muscle tissue are denser than water, whereas fat tissue is less dense. Consequently, an individual with more fat-free mass for the same total body mass weighs more in water and has a higher body density and a lower percentage of body fat.
Body volume can also be measured by air rather than water displacement. One commercially available system uses a dual-chamber plethysmograph that measures body volume by alterations in pressure in a closed chamber. This equipment is now recognised and reduces the anxiety associated with the technique of hydrodensitometry.
Credit: GE Healthcare [bone density and body composition scan)
Credit: Utah State University [hydrostatic weighing]
Credit: Utah State University [Air displacement Plethysmography]
Other applied techniques
Other feasible body composition assessment techniques include dual-energy X-ray absorptiometry (DEXA) and total body electrical conductivity (TOBEC). Unfortunately, these systems have restricted applicability when testing within the health and fitness industry due to financial costs and the need for highly trained personnel. Rather, the use of bioelectrical impedance analysis (BIA) is applied as an assessment technique in this setting.
Commonly, the accuracy of BIA is comparable to skinfolds if protocol adherence is ensured (e.g., assurance of normal hydration status), and the equations entered into the machine are valid for the specific populations being assessed. However, the capability of BIA to provide an accurate assessment of per cent body fat in obese individuals may be limited due to differences in body water distribution compared to those who are in the normal weight range (Duren et al. 2008 [Link]).
Heart Rate and Blood Pressure

The heart rate and blood pressure are two circulatory features that ensure that the supply of blood throughout the blood is appropriately maintained. The adjustment of blood supply alters depending on the physiological demands and the need for greater perfusion to the tissues. For example changes in body position [sitting to standing], exercise intensity, mode or type of exercise and the individual's psychological arousal may result in an adjustment of heart rate and blood pressure. Heart rate is often used as an indirect indicator of exercise intensity. It is used for monitoring, adjusting and individualising training programs. Chronic exercise training adaptations may also be monitored by the changes in individuals resting heart rate and also during exercise. The pressure in the arteries is in a constant state of flux and is continually being adjusted to meet demand.
Heart Rate Control
A quick and easy method to assess cardiorespiratory function is to measure the individual's heart rate (HR). Typically at rest, the adult heart beats between 60-80 beats per minute. However, in well-trained adults or individuals on specific heart medication can result in lower resting heart rate values. Conversely, an increase in resting heart may be an indicator of poor cardiorespiratory function, overtraining, increases in stress and other negative factors.
Assessing a clients HR must be performed under certain conditions. It is recommended the resting heart rate (RHR) be taken in the morning and on an empty stomach. This because during sleep and times of relaxation, the sympathetic nervous system is less stimulated, which allows the heart rate to better reflect the parasympathetic influence. The client should be placed in a distraction-free environment and seated. If the clients RHR is being monitored over time then the same environmental conditions should be replicated to ensure greater validity.
During exercise, HR is a reliable indicator of the clients own exercise intensity and is used extensively to monitor cardiorespiratory function (Ehrman et al. 2009). The heart generates its pulse via the sinoatrial (SA) node which is located on the right ventricle. The SA nod is often known as the pacemaker of the heart. The heart is innervated by sympathetic and parasympathetic nerve fibres that originate from the medulla oblongata and the cardiorespiratory control centres within the central nervous system. These fibres innervate the SA node with the atrioventricular (AV) node providing a tonic stimulus that can be either enhanced or depressed. The sympathetic nerve fibres increase heart rate and the parasympathetic nerve fibres slow the heartbeat down.
The client's HR at rest is primarily influenced by the parasympathetic system. However, at the onset of exercise, the removal of parasympathetic influence initially allows the heart rate to increase to approximately 100 beats per minute. This is then followed by an increase in sympathetic activity that further accelerates HR on circulatory demands (Wilmore, Costill, and Kenney 2008).
Exercise Intensity and Heart Rate
Heart rate can be used as a non-invasive method to assess exercise intensity due to the strong correlation with exercise intensity and oxygen consumption (Adams and Beam 2008). Numerous cardiorespiratory fitness tests use exercise HR to estimate oxygen consumption by examining steady-state HR at a given workload (Franklin 2000). Steady-state HR (SSHR) is indicated when the circulatory demands of the activity have been met by the circulatory system with no further increases in HR (Wilmore, Costill, and Kenney 2008). SSHR that ensues at any given absolute workload can alter significantly based on the individual's fitness level. For example, if a sedentary person and a highly trained person of similar size and stature were walking at four miles per hour (6.5 km/h), the sedentary person would have a much higher HR than the trained person, despite similar levels of oxygen consumption. This difference in efficiency is also reflected in the manner HR is adjusted between workloads. This is because an ineffective cardiorespiratory system relies on increases in HR more considerably to meet the demands of an increased workload. Ultimately, as exercise intensity increases, the sedentary person would approach maximal HR at a much lower workload compared to the trained person. Additionally, after exercise has stopped, the trained person’s HR would return to normal more quickly than that of the sedentary person, providing another way HR can be used to predict cardiorespiratory efficiency. Given the relative ease of measuring HR, combined with the several ways HR can be used to predict cardiorespiratory efficiency, it is apparent why HR has been widely used.
Maximal Heart Rate
Maximal heart rate (MHR) is the maximum number of heartbeats per unit of time that can be achieved during an all-out effort to volitional exhaustion. MHR appears to decline with age and is often predicted by subtracting one’s age from 220 (Fox et al., 1974). This value is fittingly called an age-predicted maximal heart rate (APMHR). For example, a 50-year-old male would estimate his APMHR as follows: 220 – 50 (age) = 170. Although this method of estimating maximal HR can vary considerably among people and is only an estimate, it is used extensively as a field method to establish the upper limits of HR, without exposing individuals to the maximal effort required to measure a true maximal HR (Franklin 2000).
Heart Rate Reserve
Once APMHR has been computed, this data can be used to determine exercise intensity guidelines based on heart rate reserve (HRR) (Franklin 2000). This prediction formula includes one variable that is affected by age (APMHR or maximal HR) and one factor that is affected by the state of fitness (RHR). Determining RHR and APMHR permits the calculation of the number of beats the person can potentially use to meet the demands of exercise (i.e., beats held in reserve). Heart rate reserve is found by subtracting RHR from APMHR. Once the number of beats in reserve has been determined, a percentage of this reserve can be calculated by multiplying this number by the desired exercise intensity expressed as a percentage. By adding a percentage of the beats held in reserve onto RHR, a target HR can be determined to provide some objective criteria for monitoring training intensity. Both a minimum and a maximum training HR can be determined so that a desired training zone adaptation can be established.
Worked Example
First determining the age-predicted maximal heart rate by subtracting the clients age from 220 (APMHR = 220 – 22 [age] = 198 bpm). Next, subtract the resting heart rate from this number to determine the number of beats that are held in reserve (198 [APMHR] – 72 [RHR] = 126 bpm [HRR]). In this case, the individual needs a minimum of 72 beats per minute to meet the body’s demands at rest and 198 beats to exercise at maximal intensity. Therefore, 126 beats are held in reserve. These beats can be added to the resting heart rate to increase the circulation of blood as needed.
For an individual wanting to train at approximately 70% of HRR, the calculation would look like this:
-
126 (HRR) × 0.70 (%) = 88.2 beats per minute
-
Target training HR = 72 (RHR) + 88.2 = 160 bpm ((70% of HRR)
Blood Pressure
Blood pressure (BP) is the force that the blood exerts on the walls of all the vessels within the cardiovascular system (Venes, 2009). The term blood pressure refers to the numerous variables that work concurrently to ensure the pressure required for blood circulation under a range of conditions (Guyton, 1991). These factors include the elasticity of the vessels, the resistance to flow before and after the capillaries, and the forceful contraction of the left ventricle, and the blood volume and viscosity (Smith and Kampine 1984). Blood pressure oscillates throughout the day depending on the metabolic demands, body position, arousal, diet, and other factors (Wilmore, Costill, and Kenney, 2008). Additionally, several hormonal, hemodynamic, and anatomical factors working together ensure the pressure needed for sufficient circulation of the blood.
As sport scientists or exercise professionals knowing the fundamental physiology of BP control and assessment is essential. As this is one of the basic vital signs used to appraise health, Blood pressure needs to be maintained within a certain range. At rest, normal systolic blood pressure is maintained between 100 and 120 mmHg, whereas diastolic blood pressure is maintained between 75 and 85 mmHg. Blood pressure that is constantly elevated (i.e., hypertension) can contribute to the development of cardiovascular disease. If BP drops too low (i.e., hypotension), blood delivery can be compromised, which may lead to circulatory shock. During exercise and other strenuous activities, BP must be altered to transport larger amounts of blood and oxygen to the tissues.
Hypertension
Hypertension is one of the most prevalent cardiovascular risk factors among Europeans (WHO 2018). This disorder is reasonably easy to identify but may go unnoticed primarily because symptoms are not evident to the average person. The primary cause of hypertension remains indefinable, yet the diagnosis and treatment of this condition are inexpensive. Therefore, routinely monitoring BP can be an effective screening tool to help those at risk before a major coronary event. The American Medical Association (Table 6), indicates the various hypertension classifications for adults. It is important to note that BP tends to fluctuate throughout the day, hypertension may be incorrectly diagnosed or even undetected, based on the time and circumstances in which it has been assessed. To increase accuracy, individuals need to monitor BP at different times during the day, preferably under the circumstances of natural daily living.
Table 6. British Hypertension Society Classification of Hypertension

Hypotension
Individuals experience hypotension when the pressure in the system is compromised or insufficient to maintain the circulatory demand. Systolic pressure less than 90 mmHg, or a diastolic pressure of less than 60 mmHg, or both, normally indicates hypotension. This absence of pressure can leave the heart, brain, and muscles with insufficient blood flow. Hypotension can occur from dehydration associated with heat illness and other pathological conditions. Although much less common than hypertension, hypotension can be a very serious medical condition. The diagnosis of hypotension is highly individualised but is characterised by a significant drop in pressure from normal. Typically, signs of hypotension are dizziness, disorientation, or confusion. Other signs include blurry vision, fainting, and weakness. Hypotension may occur acutely with an orthostatic challenge and may also be caused by alcohol, certain medications, and a variety of medical conditions. Individuals who experience hypotension on a regular basis should endeavour to identify the exact trigger and seek medical attention if necessary.
Pressure Gradients and Blood Pressure
The movement of blood through the circulatory system depends on the development of pressure gradients (PG) (Venes, 2009). When blood is placed under pressure, it inevitably seeks an area of lower pressure. When an area of lower pressure is presented, the blood flows in that direction based on how great the difference is between the pressure of the current compartment, the pressure of the new environment, and the resistance to flow within the vessel. Within the arteries, capillaries, and veins, PGs must be generated to enable the movement of blood (Smith and Kampine 1984). Blood travels from the heart into the circulation based on the PG generated by the forceful contraction of the heart in relation to the pressure in the aorta. Initially, blood leaves the left ventricle of the heart and enters circulation under relatively high pressure as the heart rhythmically contracts and relaxes (Marieb and Hoehn, 2010). As the heart beats, each cardiac cycle is comprised of a low-pressure filling phase (diastole), followed by a higher-pressure ejection phase (systole). Consequently, the volume of blood and the pressure of the blood that enters the aorta are continually fluctuating according to the cardiac cycle and the rhythmic design of PGs (Powers and Howley, 2007).
As the aorta and other large arteries receive this blood, they enlarge and store potential energy in the elastic fibres in the walls of the arteries and arterioles (Tanaka, DeSouza, and Seals, 1998). After systole has completed and the aortic valve closes, these vessels recoil and squeeze the blood, producing another PG that moves the blood to the vessels downstream. In each case, the blood moves down its PG pursuing an area of lower pressure while moving nearer to the capillaries where the exchange of gasses and nutrients can take place.
When the blood has entered the capillaries, the majority of the pressure produced from the heart has been dispersed, and the blood entering the venous side of the circulatory loop is under low pressure as it moves back to the heart (Wilmore, Costill, and Kenney 2008). To enable this blood flow in a low-pressure environment, the venous circulation is supported by three mechanisms that also create PGs. The first mechanism is the configuration of one-way valves located within the veins. These valves are arranged to promote unidirectional flow to combat gravity on the blood as it moves back to the heart.
The skeletal muscles work in conjunction with the one-way valves by increasing intramuscular pressure within the active muscles. These muscle contractions create a PG by squeezing the blood in the veins of the muscles. Lastly, the respiratory system enables venous blood movement by generating a cyclic pressure difference within the thorax that corresponds to the rising and falling of the diaphragm. Both the skeletal muscle and respiratory pumps help “milk” the blood through the veins so that it returns to the heart under the influence of almost no pressure. PGs are essential for the movement of blood through the circulatory system. Anatomically, the human body is designed to circulate blood by creating PGs to facilitate blood movement (Marieb and Hoehn 2010).
Arterial Blood Pressure Regulation
Under resting conditions, the volume of blood on the arterial side of the circulatory loop is small (13%) compared with the volume contained in the capacitance vessels of the venous circulation (64%) (Wilmore, Costill, and Kenney 2008). At rest, this distribution of blood is sufficient to meet the pressure and circulatory demands of the body. However, when an increase in ABP is required, it can be achieved by assembling the blood from the venous side of the loop and redistributing it over to the arterial side (Powers and Howley 2007). Arterial blood pressure is dynamically changed by controlling the factors that regulate the volume of blood within the system. Arterial blood volume can be changed by increasing or decreasing cardiac output (Q), increasing or decreasing total peripheral resistance (TPR), or altering both factors concurrently.
Cardiac output is the total amount of blood that leaves the left ventricle each minute. It is computed by considering the stroke volume multiplied by the number of cardiac cycles (HR) completed in one minute. Total peripheral resistance represents the resistance the blood confronts while flowing from the arterial side of the cardiovascular loop over to the venous side. The relationship between the amount of blood entering the arterial circulation and the amount of blood permitted to leave finally determines whether ABP increases decreases, or stays the same (Smith and Kampine 1984).
Acute Arterial Blood Pressure Regulation
The cardiovascular system is equipped with a negative feedback system that distinguishes ABP changes and reports them to the central nervous system, which response to alterations to blood pressure. These signals are sent to the central nervous system by specific pressure or stretch receptors termed baroreceptors (Marieb and Hoehn 2010). These receptors are strategically positioned in the aortic arch and carotid arteries, providing a tonic flow of information to cardiovascular centres within the medulla (Marieb and Hoehn 2010). Under low-pressure conditions, afferent input to the brain is decreased, and the brain responds by increasing and decreasing sympathetic and parasympathetic drive, respectively (Marieb and Hoehn 2010). Subsequently, HR and SV increase leading to increases in blood volume in the arterial circulation. A simultaneous increase in TPR prevents too much blood from exiting the arterial circuit, which eventually expands arterial blood volume and pressure. Under higher non-exertion-based pressure situations, adjustments are made in an opposing way.
Arterial Blood Pressure
Blood pressure fluctuates significantly in different segments of the cardiovascular loop. The term blood pressure is commonly used to denote arterial blood pressure (ABP), which is expressed in millimetres of mercury (mmHg). The arterial segment of the cardiovascular loop commences at the aorta and ends at the arterioles. Due to their elastic properties, these vessels can adjust to meet the dynamic pressure changes during systole and diastole. Arterial blood pressure is not a static pressure within the system, but a dynamic association between the upper and lower values attained between beats and over time. It is also important to understand that ABP is not representative of the pressure throughout all of the arteries, but a reflection of the pressure in the large arteries that are subject to the greatest degree of pressure change. Therefore, ABP is stated as two pressures. The highest pressure produced in the vessels during left ventricular contraction is denoted as the systolic blood pressure (SBP) and the lowest pressure ensues during the relaxation phase of the cardiac cycle called the diastolic blood pressure (DBP) (Pickering et al. 2005c).
The numerical difference between SBP and DBP is termed pulse pressure (PP). At rest, an elevated PP may be used as an indicator of arterial compliance (Adams and Beam 2008). During exercise and other vigorous physical activities, it would be expected that PP rises as the need for additional flow are increased. Notionally, SBP is an indicator of the pressure of blood entering the arterial circulation, while DBP signifies the resistance of blood to leave. Therefore, if the difference between these pressures increases during exercise, more blood must be both entering and leaving the arterial circulation signifying a greater flow through the tissues.
Mean arterial pressure (MAP) can be calculated using SBP and DBP. Although ABP is always in transition within the arterial system, MAP represents the mean pressure in the arteries at any period. At rest, the pressure produced during systole denotes almost one-third of the entire cardiac cycle, whereas the diastolic phase is almost twice as long (Adams and Beam 2008). Therefore, the formula for computing resting MAP must account for the fact that the heart is in the diastolic relaxation phase for a longer period of time compared to the contraction phase. The formula for calculating the MAP at rest is as follows:
-
Resting MAP = 2/3 DBP + 1/3 SBP
-
Example: 120/80 (120 systolic and 80 diastolic)
-
80 DBP × 0.666 = 53 mmHg
-
120 SBP × 0.333 = 40 mmHg
-
MAP = 53.28 + 39.96 = 93 mmHg
During exercise, the diastolic phase of the cardiac cycle is reduced as the heart rate increases making the systolic and diastolic phases approximately equal. Consequently, the formula for MAP changes slightly to account for this change:
-
Exercise MAP = 1/2 DBP + 1/2 SBP
-
Example: 140/80 (140 systolic and 80 diastolic)
-
80 DBP × 0.50 = 40 mmHg
-
140 SBP × 0.50 = 70 mmHg
-
MAP = 40 + 70 = 110 mmHg
Exercise and Arterial Blood Pressure Regulation
When clients perform an acute bout of aerobic exercise, SBP normally increases to meet the metabolic demands of the tissues. DBP will feasibly stay the same, leading to an expansion of both MAP and PP. A release of the sympathetic neurotransmitters epinephrine and norepinephrine produces an increase in both HR and SV contributing to an expansion in arterial blood volume and finally ABP. This sympathetic response produces temporary vasoconstriction of the peripheral vessels permitting less blood to exit the arterial circulation compared to the amount flowing in from the increase in Q. These variables together temporarily expand arterial blood volume, increase ABP, and promote the greater distribution of the blood to active tissues.
During acute bouts of intense anaerobic activity (e.g. resistance training), SBP normally increases substantially along with a concurrent increase in DBP. Pressures as high as 480/350 mmHg have been recorded during maximal lifts (MacDougall et al. 1985). For this reason, weight training has historically been contraindicated for many people with cardiovascular disease. However, the American Heart Association has now acknowledged the safety and potential value of strength training as a mode of therapeutic exercise if contemporary recommendations are followed.
The degree to which both SBP and DBP will be elevated may be related to the relative intensity of the exercise. During maximal or near-maximal lifting efforts, individuals often hold their breath, initiating the Valsalva manoeuvre. Although this tends to stabilise the midsection, it can also cause spikes in SBP and DBP (Sale et al. 1994; Sjøgaard and Saltin 1982). For this reason, people at risk for cardiovascular disease should avoid it.
Arterial Blood Pressure Measurement
Early approaches for measuring ABP used water columns to measure pressure, but these methods were large and significantly fluctuated on a beat-by-beat basis (Adams and Beam 2008). Finally, mercury columns were produced resulting in a more compact and manageable fluid column. Nowadays, ABP is commonly reported in millimetres of mercury (mmHg) regardless of the apparatus used for measuring. Despite their accuracy, sphygmomanometers that use mercury are vulnerable to breaking and exposing mercury, which is a toxic substance and dangerous to humans. For this reason, many health professionals have replaced automated BP cuffs or to aneroid devices. These devices are highly accurate if correctly calibrated.
A common technique using a sphygmomanometer can measure ABP at rest and during vigorous exercise (O’Brien, Beevers, and Lip 2001). Often referred to as the cuff method, this technique uses an inflatable tourniquet to temporarily occlude blood flow through the brachial artery. As the pressure is bled from the cuff, the medical professional listens to the artery below the cuff through a stethoscope and auscultates the various Korotkoff sounds (Table 7).
Arterial blood pressure can be measured using Korotkoff sounds based on how the blood flows through the brachial artery. Initially, the cuff is inflated to a pressure that prevents any blood flow through the artery. Because no blood is passing through the artery, no sounds or vibrations are detected beyond the cuff by the stethoscope. As the air pressure in the cuff is slowly released, the medical professional listens for the initial bolus of blood to pass through the previously closed artery. This first Korotkoff sound is indicative of SBP because the pressure in the artery must be higher than the pressure in the cuff if the blood in the artery has the PG needed to flow forward past the cuff through the semi- constricted artery.
As the cuff continues to be deflated, larger amounts of blood pass through the artery and the cuff during the systolic phase of each heartbeat. The classic lub-dub sound is heard while auscultating the heart directly. However, the sounds heard during blood pressure measurement are created by the blood that passes through the cuff when the pressure in the system exceeds the pressure in the bladder of the cuff. Because the cuff is still impeding some of the flow that would naturally pass through the brachial artery, vibrations can still be auscultated during this phase. Eventually, as the pressure in the cuff continues to fall, normal blood flow is restored. The pressure at which the restoration of normal blood flow and the concurrent disappearance of sound heard through the stethoscope occur is the DBP.
Table 7. Korotkoff Sounds

Measuring Blood Pressure (Modified from Perloff et al. 1993.)
1. Have paper and pencil or a device available to record SBP and DBP.
2. The client should be seated in a quiet environment with the arm resting on a table approximately at heart level.
3. Apply the cuff around the midpoint of the upper arm running the bladder over the brachial artery approximately 2 centimetres above the antecubital fossa. The aneroid gauge should be at eye level for visual inspection by the technician.
4. Place the stethoscope earpieces in your ear canals so that they are angled forward. Be sure that the bell of the stethoscope is rotated to the low-frequency position by lightly tapping on the diaphragm.
5. Place the head of the stethoscope over the brachial artery below the cuff and medial to the antecubital fossa. Press the head of the stethoscope so that the complete circumference of the diaphragm is in contact with the skin.
6. Inflate the bladder rapidly by squeezing the bulb to a pressure that is approximately 30 mmHg above previously recorded systolic pressure.
7. Open the release valve on the bulb and slowly (3 to 5 mm/sec) deflate the air from the bladder listening for the initial appearance of the Korotkoff sounds (see Table 7 for Korotkoff sounds).
8. Continue to reduce the pressure listening for the sound to become muffled (fourth phase of DBP) and finally disappear (fifth phase of DBP). Normally, the fifth phase is recorded as DBP.
9. Once the sounds disappear, continue to slowly deflate the cuff for another 10 mmHg to ensure that no further sounds are audible; then release all of the air from the bladder and wait a minimum of 30 seconds before repeating these procedures.
10. Average the two trials together and record these values for future reference.
Laboratory and field-based testing

Laboratory testing is only one form of testing and whilst it does have a place in sport and coaching science it is not always accessible or even the best means of providing the information the coach needs. Though there is sport-specific equipment, which simulates a sport’s demands very closely, generating valuable information (e.g. treadmills, cycle ergometers and rowing machines), this equipment may have limited value when assessing team and racquet sports. Field tests have a distinct advantage over laboratory testing as they are conducted in the sporting environment (e.g. sports halls, playing fields, etc.) as opposed to the controlled laboratory.
This increases the sport specificity of the tests as the data can be collected in context. However, to produce meaningful results field-based testing requires considerable thought and care in its administration. Since laboratory tests are generally conducted by sports scientists, this page will focus upon field-based testing which the coach and performer may well wish to undertake themselves.
Administering meaningful fitness tests
As indicated previously, a test must have good reliability in order to produce meaningful results. To maximise its reliability, as many variables as possible must be standardised. Factors that can affect the results of a test are:
-
the environment
-
the test protocol
-
the motivation of the performer
-
their pre-test physical state and familiarisation with the test itself
Standardising the environment and the test protocol
Environmental factors can have a profound effect on-field testing, particularly when performed outdoors due to the weather primarily. Consideration should be given to the effect alterations in the weather may have on the testing environment (e.g. slippery/muddy surfaces) and the sports performer (e.g. temperature extremes). Ideally, the tests should be performed in very similar conditions enabling comparisons to be drawn. Therefore, the coach should note environmental conditions when recording the test scores. In some circumstances, it may be necessary to cancel tests if the conditions are too adverse to allow uncompromised performance.
Unless a test protocol is closely standardised it will not generate meaningful data that can be compared. For example, there are a number of variations of the sit-up, each of which affects the difficulty of the exercise and consequently the number of repetitions they are likely to achieve. Therefore, the preferred version needs to be selected, carefully administered and the details recorded for future test comparisons. In tests where a time limit is used to generate a test score, the quality of the movement assessed must be standardised and must not be sacrificed in the desire for speed. If conducting a test of speed or agility which requires the use of markers or cones, it is vital that the position of these is recorded precisely.
Test participants should be fully informed of what is expected of them. Leading up to a test it may be necessary to ask them to adhere to pre-test behaviour which could otherwise affect the results. This might include instructions about nutrition, level of training 48 hours pre-test, the consumption of alcohol and even smoking. Most physical tests are enhanced by a warm-up and therefore a standard warm-up should be performed by the participants. The exact content of the warm-up will depend upon the sport and test but is likely to be similar to that used before a competition. If conducting a series of tests, the sequence in which they are performed can be important, as fatigue from one test can affect the results of another test. Therefore the test sequence and if appropriate, duration of recovery between tests should be standardised and if repeated either on the same individual or another squad member the tests should be carried out identically. When conducting a set of fitness tests within one session it is generally recommended that they are performed in the following sequence (i) height, weight and physique measurements; (ii) aerobic fitness; (iii) muscular strength and endurance; and (iv) flexibility.
However, if the aerobic test is maximal it could impact the muscular strength and endurance tests and therefore these should go before aerobic fitness. Indeed in an ideal situation, the tests should be performed on separate days to allow for full recovery following maximal effort. Enhancing test standardisation through familiarity Familiarity with test procedures can affect the results and it may be necessary for the participant to repeat the test several times (generally 2-4 times for most field tests) before a true measurement can be attained. For some non-exhaustive tests, a repeat measurement may take place within a matter of minutes, whereas for exhaustive tests several hours or even days may be required to fully recover. The basis of checking for familiarisation is that as fitness improvements are unlikely to occur in a matter of days, any observed improvements in the test score are likely due to increased familiarity. If a test requires a particular technique or skill, some familiarisation/practice should be included in the warm-up preceding the test to ensure that the participant is fully familiar with the test requirements.
Analysing tests and providing feedback
After a fitness test, the coach should compare the test scores with those they would expect for participants in their sport and/or against an individual’s previous test results. If this results in particular fitness components being identified as requiring specific attention, then relevant training can be prescribed.
Feedback to the performer is vitally important, as it can illustrate how the process can help them improve and even increase motivation. The process of fitness testing does not stop at the end of the test as data interpretation, feedback and the application of the results are what make the process valuable. Feedback must be clear, concise and relevant to the individual’s performance in their sport, with the accrued data applied in an appropriate training context.
What fitness tests cannot do
Fitness tests will not automatically create better performers and should not be used purely for selection purposes. They are a tool, which if used correctly, can provide valuable information that the coach can utilise when designing training programmes and in combination with other factors that are important for a good performance (e.g. technical skill, tactical awareness, mental attitude, etc) can be used to improve a team’s performance.
Selecting and using fitness tests
This document provides further information on the types of tests used for the various components of fitness – aerobic fitness, muscular endurance, muscular strength, flexibility, speed/ acceleration, power and sport-specific speed/agility. When developing a series of fitness tests, the coach should first refer to other coaching and sport science information. There they may find established tests that are proven for their own sport or at least suitable tests designed for similar sports that can be used with or without minor modifications. This will obviously greatly reduce the time required to deliver an effective series of tests while providing the coach with reassurance that the tests they are using are appropriate.
Aerobic fitness tests
Tests for aerobic fitness must use the same type of exercise as the sport in which the individual participates and should generally last in the region of 8-15 minutes, any shorter and the increased anaerobic energy contribution may make the test less valid. For runners, established tests include the 12 minute “Cooper” or 15-minute “Balke” run, in which the participants endeavour to cover as much distance as possible. Similar field tests could be developed for cyclists and other endurance events. Alternative tests require the participants to complete a set distance as quickly as possible (typically ~1.5 miles as this has been shown to be a good indicator of aerobic fitness and is generally completed in 8-15 minutes), with those achieving the quicker times being deemed to have the better aerobic fitness.
For team and racquet games players, the 20 m Multistage Shuttle Run Test is a popular option and requires the participants to complete 20m shuttle runs in time to a pre-recorded cassette/ CD/ download. The speed at which they are required to run increases every minute and the point at which participants are unable to sustain the required speed can be used to estimate their VO2max. Though, it may be simpler to record the number of levels/ shuttles completed, with a greater number completed indicating better aerobic fitness.
Muscular endurance tests
These tests may assess either dynamic muscular endurance (the capacity to repeat contractions) or static muscular endurance (the capacity to sustain a muscular contraction). To be specific to a sport it is important to ensure that the test uses the appropriate muscle groups, through relevant ranges of movement and at suitable speeds. Often this may not be entirely feasible and therefore standard endurance exercises such as the sit-up and press-up may be used. Typically, tests for dynamic muscular endurance are performed to see how many exercises the participant can complete in a designated time (e.g. 30 seconds, a minute or even two minutes) or until exhaustion with unlimited time. However, the quality of the movement must be standardised and not sacrificed in the desire for speed. In an attempt to overcome this, the participants could be required to complete a closely standardised exercise (e.g. sit-ups or similar) in time to a prerecorded cassette/CD/ download. The flexed arm hang is an example of a static endurance test, and involves participants raising themselves on a bar/beam set just above head height with both arms so that their chin is above the bar and then hold for as long as possible. The coach would need to decide whether an overhand or underhand grip should be used and what the criteria are for ending the test.
Muscular strength tests
Tests for muscular strength should ensure that the muscles being assessed are appropriate and are used through a relevant range of movement, or in the case of static strength at a specific joint angle. In a laboratory setting, equipment such as dynamometers are often used but alternative tests may require the lifting of weights (free weights or exercise machines). Typically this would involve an appropriate warm-up followed by a lifting test until a maximum level is reached. Depending upon the sport, the coach may wish to assess the participant’s maximum strength based on a single repetition or their capacity to repeat a number of contractions. In both cases, the participant starts at a relatively heavyweight and if successful in completing the required number of repetitions rests before attempting a heavier weight. With this form of testing, the coach must be aware of the potential for each lift to cause fatigue. Hence participants should rest for 5-10 minutes between lifts and it may be necessary to implement a familiarisation session to allow a subsequent test to initiate nearer the participants maximum strength.
Flexibility / joint mobility tests
Field tests for flexibility/joint mobility range from simple “Yes / No” assessments of whether the individual can perform a specific task, to the measurement of joint angles and ranges of movement (e.g. Sit and Reach test). By breaking down a movement into its component parts, the coach will be able to determine which joint movements are essential to performance and need to be assessed. For example, in hurdling, good hip mobility and hamstring flexibility are necessary for good technique, whereas in team sports (e.g. football) an appropriate level of flexibility is required to reduce injury risk. When standardising tests of flexibility/joint mobility the coach must pay close attention to, and note the position of all limbs, not just those being assessed. For example, if measuring hamstring flexibility in one leg the position of the other leg will influence the results. Similarly, if measuring hip flexibility, movement in the back or pelvis may cause the measurement to be overestimated.
Speed and acceleration tests
When assessing speed, the distance used needs to be appropriate to the sport and the coach must carefully determine what happens in a game or event. In a sport such as Cricket, the test may be conducted over the distance between the wickets. In order to ensure the test is even more specific, the test should be conducted in full clothing and kit.
Tests of power
The anaerobic power of a sports performer can be generated from two energy systems: (i) Creatine Phosphate and (ii) Glycolysis. As the relative contribution of these systems depends upon the duration of the maximal effort, the duration of tests for power is important. In activities lasting less than 6 seconds (e.g. jumping, shot putt, etc) the energy primarily comes from stored Adenosine Triphosphate (ATP) and Creatine Phosphate. Jumping and throwing tests (i.e. vertical jump test) are popular in assessing these activities. A standardised throwing test can be devised to assess arm power, though technique and performance familiarity will significantly impact the test results and so should be standardised. In activities that last between 10 and 30 seconds, anaerobic glycolysis becomes increasingly important. So for sustained sprints of around 30 seconds, a different aspect of power needs to be assessed. To assess glycolytic anaerobic power, sustained maximal sprints can be utilized. In a laboratory setting the most widely used is the 30 second “Wingate” sprint using a cycle ergometer. However, the use of Cycling tests may not be relevant for other activities and a running sprint of 200- 300m may be more valid.
Understanding Aerobic Capacity
Table 1. Female Maximal Oxygen Consumption Rates


Understanding Aerobic Capacity
It is important to understand the relationship between the consumption of oxygen, energy production, and physical work. Metabolism originates from the Greek word for “change” and refers to all the chemical and energy transformations that occur in a cell. Food is broken down within the body into ATP in the mitochondria through a process called aerobic respiration and the electron transport system. The overall chemical reaction for converting glucose into ATP is:
ATP is then transformed into mechanical energy to maintain cellular and bodily functions including moving our muscles. Oxygen is essential for making ATP, so oxygen consumption is a reflection of ATP production (and usage). Energy expenditure can be indirectly evaluated by measuring the rate of oxygen consumption, or VO2. The units of VO2 are ml O2 consumed/kg body weight/min (the units L/min are sometimes used for non-weight bearing exercise). VO2 is the rate that oxygen is used by the body, not the amount of oxygen inhaled. Oxygen consumption changes as the body's activity level changes and more ATP is required. VO2 measured at rest will be lower than VO2 measured during physical activity.
An individuals physical fitness can be assessed by the volume of oxygen that can be consume while exercising at their maximum aerobic capacity (also know as VO2max). The VO2max is the maximum amount of oxygen in millilitres, one can use in one minute per kilogram of body weight. VO2 max reflects an individuals overall fitness level, which is one's maximum potential for using oxygen to make ATP. VO2 max is defined by the limits of an individuals oxygen transport system, so this value does not alter from moment to moment in the same way that VO2 will change. Individuals who are more physically fit will be able to use oxygen more efficiently (have a higher VO2 max), and can therefore produce more ATP and perform more work with less effort. Factors that can affect VO2 max include general respiratory and cardiovascular health, the amount of mitochondria in the muscle cells, and vascularisation of the muscle tissue. A person can increase their VO2 max over time with physical training. Those individuals who are physical fit have higher VO2max values and can perform exercise more intensely than those who are not as well conditioned. There are several studies that report that individuals can increase their VO2max by calculating at an intensity that elevates the heart rate between 65 and 85% of the maximum values for a minimum of 20 minutes for three-to-five times per week. A mean (average) value of VO2max for male athletes is approximately 3.5 litres/minute and for female athletes it is about 2.7 litres/minute.

Table 2. Male Maximal Oxygen Consumption Rates

Graded Exercise Testing: Guidelines and Procedures
Exercise scientists and physicians use exercise assessments to evaluate individuals VO2max independently. The VO2max, determined from graded maximal or submaximal exercise tests, is used to classify the cardiorespiratory fitness level of your client (Table 1 and 2). The baseline and follow-up data can be used to evaluate the progression of exercising individuals and to set realistic goals. The use of heart rate (HR) and oxygen uptake data attained during the graded exercise test allows for accurate and specific exercise prescriptions.
As discussed previously it is important to screen individuals before the start of a vigorous (> 60% VO2max or >6 METs [metabolic equivalents]) exercise program. The ACSM (2017) recommends a graded maximal exercise test for high-risk individuals with one or more signs or symptoms of cardiovascular, pulmonary, renal, and metabolic disease and for high-risk individuals with known cardiovascular, pulmonary, renal, or metabolic disease. However, the use of submaximal exercise tests or maximal exercise tests for low-risk individuals as well as individuals with moderate risk if they are starting either a moderate (40–60% VO2max or 3–6 METs) or vigorous (≥ 60% VO2max or > 6 METs) exercise program (ACSM 2017).
Guidelines for Graded Exercise Testing
The selection of maximal or submaximal graded exercise test (GXT) to assess the cardiorespiratory fitness of the individual is dependent on several factors:
-
the individuals risk stratification (low risk, moderate risk, or high risk),
-
the reasons for administering the test
-
the availability of applicable equipment and qualified staff.
In both the clinical and research settings, VO2max is normally measured directly, which involves costly equipment and experienced staff. Although VO2max can be projected from maximal exercise intensity with a reasonable degree of accuracy, submaximal tests also provide a practical estimate of the individual’s cardiorespiratory fitness level. These tests are less expensive, less time-consuming, and risky. Submaximal exercise testing, however, has been suggested to be less sensitive as a diagnostic device for coronary heart disease (CHD).
In both cases, the exercise test should gradually increase submaximal workloads. Many frequently used exercise test protocols require that each workload be performed for 3 min. The GXT measures maximum functional capacity (VO2max) when the oxygen uptake plateaus and does not increase by more than 150 ml.min−1 with a further increase in workload. However, many individuals do not reach a VO2 plateau, other criteria may be used to suggest the attainment of a true VO2max:
-
Failure of the heart rate to increase with increases in exercise intensity
-
Venous lactate concentration exceeding 8 mmol.L−1
-
Respiratory exchange ratio (RER) greater than 1.15
-
Rating of perceived exertion (RPE) greater than 17 using the original Borg scale (6-20)
If the test is terminated before the individual reaches a plateau in VO2 and an RER greater than 1.15, the GXT is a measure of VO2peak rather than VO2max. Children, older adults, sedentary individuals, and clients with the known diseases are more likely than other groups to attain a VO2peak rather than a VO2max.
Procedures for Cardiorespiratory Fitness Testing
Individuals should be given pre-test instructions one day prior to the exercise test. The client should read and sign the informed consent and PAR-Q prior to graded exercise testing, the client should read and sign the informed consent and complete the PAR-Q. Pretest, exercise, and recovery heart rates can be measured using the palpation or auscultation technique (if an HR monitor or ECG recorder is unavailable). Because of the unrelated noise and vibration created during exercise, it may be difficult to obtain accurate measurements of blood pressure, especially when the individual is running on a treadmill.
For many years, the Borg scales were the primary method used to attain ratings of perceived exertion (RPE) during exercise testing. The original scale (6–20) and the revised scale (0–10) allow individuals to rate their degree of exertion subjectively during exercise and are highly related to exercise heart rates and VO2. Both RPE scales consider the linear rise in heart rate and VO2 during exercise. The revised scale also reflects nonlinear changes in blood lactate and ventilation during exercise. Ratings of 6 on the original scale and 0 on the revised scale correspond to no exertion at all; ratings of 10 on the revised scale and 19 on the original scale usually correspond with the maximal level of exercise (Borg, 1998). Moderate-intensity exercise is rated between 12-14 on the original scale and rated 5-6 on the revised scale. Ratings of perceived exertion are valuable in determining the endpoints of the GXT, particularly for patients who are taking beta-blockers or other medications that may alter the heart rate response to exercise.
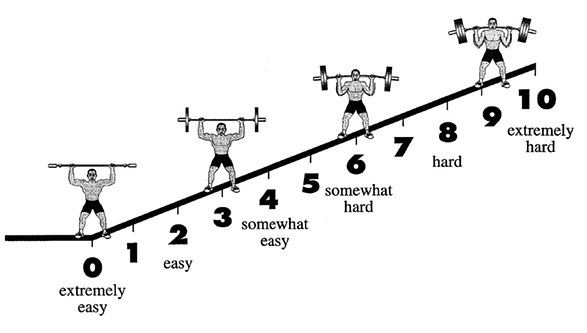
Alternatively, individuals can use the OMNI scales to obtain individuals RPE for various modes of exercise testing. The OMNI scales can be used to measure RPE for the overall body, the limbs, and the chest. These scales were originally developed for children and adolescents using a picture system to illustrate intensity (0 = extremely easy to 10 = extremely hard) of effort during exercise. Later the scales were modified for use with adults engaging in cycle ergometer, treadmill, stepping, elliptical, and resistance exercises. As part of the validation testing for the cycling, stepping, elliptical, and treadmill ergometry scales, the OMNI RPE values were correlated with HR and VO2 data. Concurrent validity coefficients ranged from 0.81 to 0.95 for HR and OMNI RPE (Robertson 2004). For resistance exercise, RPE values from the OMNI scale were correlated with the weight lifted, yielding validity coefficients ranging from 0.72 to 0.91 (Robertson 2004; Robertson et al. 2005). Similar to the Borg scales, the OMNI scales can be used by individuals to monitor the intensity of the workouts during aerobic and resistance exercise training. For a detailed discussion of how to use these scales, refer to the work of Robertson (2004).
Adult OMNI-Step RPE Scale (Robertson, 2004)

Adult OMNI-resistance RPE Scale (Robertson, 2004)
Test Termination
In a maximal or submaximal GXT, the exercise regularly continues until the individual voluntarily terminates the test or a predetermined endpoint is reached. However, an exercise scientist must be conscious of all indicators for discontinuing a test. If any of the following signs or symptoms occur the exercise test should be stopped prior to the individual reaching VO2max (for a maximal GXT) or the predetermined endpoint (for a submaximal GXT).

Maximal or Submaximal Aerobic Tests

What type of tests to perform
Cardiorespiratory fitness is an essential component of fitness for a large majority of sports. Coaches and fitness trainers must carefully consider the clients or performers physical fitness level they consider to be applicable for optimum performance. For example, in professional football a greater aerobic capacity is critical, but for volleyball, a moderate level will serve. For most invasion games, aerobic fitness dictates how quickly one recovers between high-intensity segments, and how much distance can be covered in a game setting.
Maximal or Submaximal Testing?
Maximal oxygen uptake (VO2max) is acknowledged as the standard measure of cardiorespiratory fitness. This variable is normally expressed as mL.kg-1 min-1) as opposed to absolute (mL.min-1) terms, allowing for comparisons between individuals with differing body weights. VO2max is the product of the maximal cardiac output [Q] and arterial-venous oxygen difference. It is important to be aware that there is significant variation in VO2max across populations and fitness levels results mainly due to the differences in Q in individuals without pulmonary disease; therefore, VO2max is correlated to the functional capacity of the myocardium. VO2max, therefore implies an individual’s true physiological limit has been reached and a plateau in VO2 may be observed between the final two work rates of a progressive exercise test. This plateau is rarely observed in individuals with CVD or pulmonary disease. Therefore, VO2max is commonly used to describe cardiorespiratory fitness in populations with chronic diseases and health conditions.
Open circuit spirometry is frequently used to assess individuals VO2max. This procedure requires the subject to breathe through a low-resistance valve with their nose sealed while pulmonary ventilation and expired fractions of oxygen and carbon dioxide are measured. Supervision of the test and interpretation of results should always be reserved for professionally qualified personnel with a thorough understanding of exercise science. Due to the fiscal costs associated with using this equipment the direct measurement of VO2max normally is reserved for research or clinical settings [See link of the performed direct test.
When the direct measurement of VO2max is not practicable, a variety of submaximal and maximal exercise tests can be used to estimate VO2max. These tests have been validated by observing (a) the relationship between directly measured VO2max and the VO2max estimated from physiologic responses to submaximal exercise (e.g. heart rate at a specified power output); or (b) the correlation between directly measured VO2max and test performance, or time to volitional fatigue using a standard graded exercise test (GXT) protocol. However, you should be aware that there is the potential for a significant overestimation of directly measured VO2max by these types of indirect measurement techniques. Overestimation is more likely to occur when (a) the exercise protocol chosen for testing is too stressful for specific individuals (i.e. Bruce treadmill protocol in patients with CVD); or (b) when treadmill testing is employed and the individual heavily relies on handrail support. Each individual's physical characteristic must be considered when selecting appropriate exercise protocols.
The choice of whether to use a maximal or submaximal exercise test is dependent largely on the motives for the test, the risk level of the client, and accessibility of appropriate equipment and trained personnel. VO2max can be estimated using conventional exercise test protocols by considering test duration at a given workload on an ergometer and using the prediction equations. Importantly you should consider the specific population group being assessed. Maximal tests require individuals to exercise to the point of volitional fatigue, which might require medical supervision and/ or emergency equipment.
However, maximal exercise testing offers increased sensitivity in the diagnosis of coronary heart disease in asymptomatic individuals and provides a better estimate of VO2max. Additionally, the use of open-circuit spirometry during maximal exercise testing increase reliability with an accurate assessment of the individual's ventilatory threshold and direct measurement of VO2max. However, most consultants generally rely on submaximal exercise tests to assess cardiorespiratory fitness because maximal exercise testing is not always possible in the fitness setting. In the fitness setting, the fundamental aim of submaximal exercise testing is to determine the heart rate response to one or more submaximal work rates and use the results to predict VO2max. Although the main purpose of the test has traditionally been to predict VO2max from the heart rate workload correlation, it is important to obtain additional indices of the client’s response to exercise. You should use various submaximal measures of heart rate, blood pressure, workload, rating of perceived exertion, and other individual indices as valuable information regarding individuals functional response to exercise.
The most precise estimate of VO2max is attained from the heart rate response to submaximal exercise tests if all of the following expectations are reached:
-
A steady-state heart rate is achieved for each exercise work rate.
-
A linear relationship exists between heart rate and work rate.
-
The difference between actual and predicted maximal heart rate is minimal.
-
The individual is not on any medication, consumed high quantities of caffeine, under large amounts of psychosomatic stress, is unwell, or is in a high temperature/humidity environment, all of which may alter heart rate responses.
Common modes of VO2 testing
Frequently used modes for exercise testing include treadmills, cycle ergometers, step boxes, and an array of field tests. The mode of exercise testing used is always dependent on the available equipment available, and the training status of each individual. Medical supervision is always recommended for high-risk individuals. It is important to be aware of the advantages and disadvantages of each exercise testing mode. Each of these will be discussed:
Field tests
Field tests include walking or running at a predetermined time or distance. The main advantages of field tests are they are easy to administer and require minimal equipment. The disadvantages are some tests can be deemed maximal for some individuals, specifically in individuals with low aerobic fitness, and feasibly be unmonitored for blood pressure and heart rate. Additionally, clients motivational levels and pacing capability may also impact their test results. Field-based ‘all-out run’ assessments may be inappropriate for inactive individuals or those that may have cardiovascular and/or musculoskeletal complications. Nonetheless, VO2max can be assessed from the obtained test results.
Treadmills
Treadmills may be used for both submaximal and maximal testing and are often employed for diagnostic testing in the UK. These devices provide a common form of exercise and, if the correct protocol is selected, can accommodate a range of clients (i.e. inactive to elite individuals) across the continuum of walking to running speeds. Nevertheless, familiarisation and a practice session may in some cases be required to permit adjustment and reduce anxiety. However, treadmills are expensive, not easily transportable, and potentially make some measurements more difficult to obtain, especially while running.
Mechanically braked cycle ergometers
These devices are a viable test modality for both submaximal and maximal testing and are frequently used for diagnostic testing. Advantages of this exercise mode include lower equipment expense, transportability, and greater ease in obtaining measurements. Cycle ergometers also offer a non-weight-bearing test modality in which work rates are easily adjusted in small increments. The main disadvantage is that the cycle ergometer must be calibrated, and the individual clients must maintain the proper pedal cadence rate because most tests require heart rate to be measured at specific work rates.
Step testing
This testing mode is inexpensive a modality for predicting cardiorespiratory fitness by measuring the heart rate response to stepping at a fixed rate and/or a fixed step height or by measuring post-exercise recovery heart rate. Step tests require minimal equipment, steps are easily transportable, the stepping skill requires little practice, the test itself is of short duration, and stepping is advantageous for mass testing. Post-exercise (recovery) heart decreases with improved cardiorespiratory fitness, and test results are easy to explain to individuals. However, special precautions may be needed for those who have balance problems or are extremely deconditioned. Some single-stage step tests require an energy cost of 7–9 metabolic equivalents (METs), which may exceed the maximal capacity of the participant. Therefore, the protocol chosen must be appropriate for the physical fitness level of the client. Also, inadequate compliance with the step cadence and excessive fatigue in the lead limb may diminish the value of a step test.
Frequently used field tests
The two most widely used walk/run tests for assessing cardiorespiratory fitness are the Cooper 12-min test. The objective of the 12-min test is to cover the greatest distance in the allotted period and for the 1.5-mi (2.4 km) test to run the distance in the shortest period. The Rockport One-Mile Fitness Walking Test is another well-recognised field test for estimating cardiorespiratory fitness. In this test, an individual walks one mile (1.6 km) as fast as possible, preferably on a track or a level surface, and the heart is obtained in the final minute. An alternative is to measure a 10-second heart rate immediately on completion of the one-mile walk, but this may overestimate the VO2max compared to when heart rate is measured during the walk. VO2max is estimated from a regression equation based on weight, age, sex, walk time, and heart rate.
Additionally, to independently predict morbidity and mortality, the 6-min walk test (Link) has been used to evaluate cardiorespiratory fitness in older adults and some clinical patient populations. The American Thoracic Society has published guidelines on 6-min walk test procedures and interpretation (Link). Even though the test is considered submaximal, it may result in near-maximal performance for those with low physical fitness levels or disease. Clients completing less than 300 m during the 6-min walk demonstrate a poorer short-term survival compared to those surpassing this threshold. Several multivariate equations are available to predict VO2max from the 6-min walk; however, the following equation requires minimal clinical information:
Where m = distance in meters; yr. = year; kg = kilogram; cm = centimetre; RPP = rate pressure product (HR = systolic BP [SBP] in mm Hg).

Maximal Exercise Tests
Several maximal exercise test protocols have been developed to evaluate individuals cardiorespiratory capacity. Exercise scientists should be able to select an exercise mode and test protocol that are appropriate for each specific individual (reflecting the age, gender, and health and fitness status). Frequently used modes of exercise are treadmill walking or running and stationary cycling. Arm ergometry is beneficial for individuals with paraplegia and individuals who have restricted use of the lower extremities. Similarly, combined leg and arm ergometry and total-body recumbent stepper exercise tests may be suitable substitutes to treadmill testing for evaluating the cardiorespiratory fitness of older persons with balance deficits, gait impairments, and decreased coordination (Billinger, Loudon, and Gajewski, 2008).
The exercise test can be either continuous or discontinuous. A continuous exercise test is performed with no rest between work increments. Continuous exercise tests can differ in the duration of each exercise stage and the magnitude of the increment in exercise intensity between stages. The ACSM (2017) recommends that the total test duration should be between 8-12 minutes to increase the likelihood of individuals reaching VO2max. For most continuous exercise test protocols, the exercise intensity is increased gradually throughout the test, and the duration of each stage is usually 2 or 3 min, allowing most individuals to reach a steady-state VO2 during each stage. Across the stages of this type of GXT, the workload may increase linearly or nonlinearly. Each increment in workload is dictated by the specific protocol and does not vary among individuals. Although this type of GXT is widely used in research and clinical settings, it may not be optimal for assessing the functional capacity of all individuals, especially those with low exercise tolerance. Continuous graded exercise tests may also limit the ability of very fit individuals to satisfy some of the criteria commonly associated with attaining VO2max (Mier, Alexander, and Mageean, 2012).
Currently, continuous ramp-type tests are increasing in popularity and are extensively used because they can be adapted for the individual estimated exercise tolerance. For example, increments in work rate during a ramp protocol are much higher for endurance-trained athletes than for sedentary individuals (e.g. 40 W.min−1 vs. 12 W.min−1). Additionally, each exercise stage for ramp protocols is much shorter (e.g. 20 sec) than that of the traditional continuous GXT protocols (2–3 minutes). Ramp protocols provide continuous and frequent increments in work rate throughout the test so that the VO2 increases linearly and are intended to bring individuals to their limit of exercise tolerance in approximately 10 minutes. Ramp protocols allow some individuals to reach a higher exercise tolerance compared to traditional GXT protocols.
However, there are disadvantages. To design an individualised ramp protocol, the maximum work rate for each client must be predetermined or precisely assessed from training records or questionnaires so that the correct work rate is selected that allows each individual to reach their peak exercise tolerance in approximately 10 minutes. Also, ramp protocols increase work rate repeatedly, requiring more expensive electromagnetically braked cycle ergometers and programmable treadmills that make quick and even transitions between the stages of the exercise test. Lastly, inexperienced persons may have difficulty assessing exercise blood pressure during each minute of the ramp protocol.
For discontinuous exercise tests, the subject rests for 5 to 10 minutes between workloads. The workload is gradually increased until they reach their maximum exercise tolerance. Normally, each stage of the discontinuous protocol lasts between 5 or 6 minutes, allowing VO2 to reach a steady state. On average, discontinuous tests are more time consuming and can take five times longer to administer than continuous tests. McArdle and colleagues (1973) compared the VO2max results as measured by six commonly used continuous and discontinuous treadmill and cycle ergometer tests. They reported that the VO2max values for the cycle ergometer tests were approximately 6% to 11% lower than for the treadmill tests. Many subjects identified local discomfort and fatigue in the thigh muscles as the major factors limiting further work on both the continuous and discontinuous cycle ergometer tests. For the treadmill tests, subjects indicated general fatigue as the limiting factor and complained of localised fatigue and discomfort in the calf muscles and lower back.
Maximal Exercise Treadmill Tests
Generally, the treadmill is the preferred exercise test modality and is implemented on a motor-driven treadmill with variable speed and incline. The workload on the treadmill is raised through increases in the speed or incline or both. The workload is usually expressed in miles per hour and per cent grade.
Balke Treadmill Protocol
To administer the Balke and Ware (1959) exercise test protocol (Figure 4.2), the treadmill speed should be set at 3.4 mph and the initial grade of the treadmill at 0% during the first minute of exercise. Subjects should maintain a constant speed on the treadmill throughout the full exercise test. At the start of the second minute of exercise, the gradient should be increased to 2%. Then, at the beginning of every additional minute of exercise, increase the grade by only 1%.
Use the nomogram (below) developed for the Balke treadmill protocol to compute the VO2max of an individual. To use this nomogram, detect the time corresponding to the last complete minute of exercise during the protocol along the vertical axis identified “Balke time,” and draw a horizontal line from the time axis to the oxygen uptake axis. Ensure that the correct plot relates to the exercise time of women and men in the appropriate column when using this nomogram.


Nomogram for Balke graded exercise test.
Bruce Treadmill Protocol
TThe Bruce, Kusumi, and Hosmer (1973) exercise test is a multistage treadmill protocol. The protocol increases the workload by altering both the treadmill speed and percent grade. During the first stage (initial 1–3 minutes) of the test, the normal individual walks at a 1.7 mph pace at 10% grade. At the start of the second stage (4–6 minutes), increase the gradient by 2% and the speed to 2.5 mph. In each subsequent stage of the test, increase the grade by 2% and the speed by either 0.8 or 0.9 mph until the subject is exhausted. Use the nomogram developed for the Bruce protocol. Plot the individuals exercise time for this protocol along the vertical axis labelled “Bruce time,” and draw a horizontal line from the time axis to the oxygen uptake. Again, ensure to use the appropriate column for men and women.

Bruce graded exercise test protocol

Nomogram for Bruce graded exercise test.
Modified Bruce Protocol
The modified Bruce protocol (see figure to the right) is more appropriate than the Bruce protocol for high-risk and elderly individuals. However, with the exception of the first two stages, this protocol is comparable to the standard Bruce protocol. Stage 1 starts at 0% grade and a 1.7 mph walking pace. For stage 2, the % grade is increased to 5%. McInnis and Balady (1994) evaluated the physiological responses to the standard and modified Bruce protocols in patients with CHD and reported comparable heart rate and blood pressure responses at matched exercise stages despite the additional 6 minutes of low-intensity exercise performed using the modified Bruce protocol.

Modified Bruce graded exercise test
Population-Specific and Generalised Equations for Treadmill Protocols

Maximal Cycle Ergometer Exercise Tests
The cycle ergometer is the preferred testing instrument used for evaluating cardiorespiratory fitness on individuals with conditions that affect their ability to safely walk or run on a treadmill. On a friction type cycle ergometer (mechanically braked), resistance is applied against the flywheel using a belt and weighted pendulums. The handwheel alters the workload by tightening or loosening the brake belt. The workload on the cycle ergometer is magnified through increases in the resistance on the flywheel. The power output is typically expressed in kilogram-metres per minute (kgm·min−1) or watts (1 W = 6 kgm·min−1) and is measured using the following equation:
-
power = force × distance / time
where force equals the resistance setting on the ergometer (kilograms) and distance is the distance travelled by the flywheel border for each revolution of the pedal multiplied by the number of revolutions per minute. On the Monark ergometers, the flywheel travels 6 metres per pedal revolution. Therefore, if the resistance of 2 kg is applied and the pedalling rate is 60 rpm, then:
-
power = 2 kg × 6 m × 60 rpm = 720 kgm·min−1 or 120 W.
Most cycle ergometer test procedures for untrained cyclists use a pedalling rate of 50 or 60 rpm, and power outputs are increased by 150 to 300 kgm·min−1 (25–50 W) in each stage of the test. However, you can use higher pedalling rates (≥80 rpm) for trained cyclists. A pedalling rate of 60 rpm produces the highest VO2max when compared with rates of 50, 70, or 80 rpm (Hermansen and Saltin, 1969). The figures below illustrate some widely used discontinuous and continuous maximal exercise test protocols for the cycle ergometer.
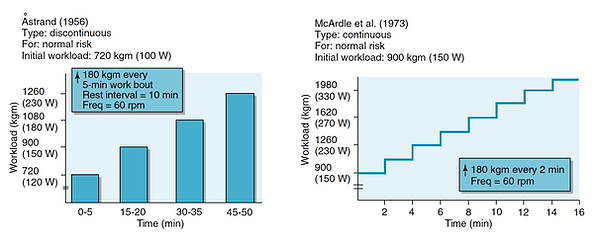

To compute the energy expenditure for the cycle ergometer exercise, use the ACSM equations provided in the table below. The total energy expenditure in ml·kg−1·min−1, is a function of the oxygen cost of pedalling against resistance (power output in watts), the oxygen cost of unloaded cycling (approximately 3.5 ml·kg−1·min−1 at 50–60 rpm with zero resistance), and the resting oxygen consumption.

Astrand Cycle Ergometer Maximal Test Protocol
For the Astrand (1965) continuous test protocol (see figure above), the preliminary power output is 300 kgm.min−1 (50 W) for women and 600 kgm.min−1 (100 W) for men. Since the pedalling rate is 50 rpm, the resistance is 1 kg for women (1 kg x 6 m x 50 rpm = 300 kgm.min−1) and 2 kg for men (2 kg x 6 m x 50 rpm = 600 kgm.min−1). The subject should exercise at this initial workload for 2 minutes. Then the power output increases every 2 to 3 minutes in increments of 150 kgm.min−1 (25 W) and 300 kgm.min−1 (50 W) for females and males, respectively. Subjects continue the test until they are exhausted or can no longer maintain the pedalling rate of 50 rpm. Again use the ACSM metabolic equation for leg ergometry to estimate the VO2 from your subjects power output during the last steady-state stage of the GXT.
Fox (1973) Maximal Cycle Ergometer Test
The Fox (1973) protocol is a discontinuous test involving a series of 5-minute exercise bouts with 10-minute rest intervals. The starting workload is between 750 and 900 kgm.min−1 (125–150 W) for males and 450 and 600 kgm.min−1 (75–100 W) for females. The progressive increments in work depend on the subjects heart rate response and are typically between 120 and 180 kgm.min−1 (20–30 W). The subject exercises until exhausted or until no longer able to pedal for at least 3 minutes at a power output that is 60 to 90 kgm.min−1 (10–15 W) higher than the previous workload. Again you can use the metabolic equations to convert the power output from the last steady-state stage of this protocol to VO2max.
Maximal Bench Stepping Exercise Tests
The least favourable mode of exercise for maximum exercise testing is the bench stepping test. During bench stepping, the subject is performing both positive (up to phase) and negative (down phase) work. Morehouse (1972) reported that approximately one-quarter to one-third less energy is expended during negative work. This factor, combined with altering the step height and stepping rate for differences in body weight, makes standardisation of the work difficult.
Most step test protocols increase the intensity of the work by gradually increasing the height of the bench or stepping rate. The work (W) performed can be calculated using the equation W = F x D, where F is body weight in kilograms and D is bench height times the number of steps per minute. For example, a 60 kg female stepping at a rate of 22 steps.min−1 on a 30 cm (0.30 m) bench is performing 330 kgm.min−1 of work (60 kg x 0.30 m x 22 steps.min−1).
The following equations by Morehouse (1972) can be used to adjust the step height and stepping rate for differences in body weight to achieve a given work rate:
-
step height (cm) = work (kg cm.min−1) / body weight (kg) x stepping rate
-
stepping rate (steps.min−1) = work (kgcm.min−1) / body weight (kg) x step height (cm)
For example, if you devise a graded step test protocol that requires a client weighing 50 kg to exercise at a work rate of 300 kgm.min−1, and the stepping rate is set at 18 steps.min−1, you need to determine the step height that corresponds to the work rate:
-
step height = 300 kgm.min−1 / (50 kg x 18 steps.min−1)
-
= 0.28 m, or 28 cm
Alternatively, you may choose to keep the step height constant and alter the stepping cadence for each stage of the GXT. For example, if the step height is set at 30 cm (0.30 m), and the procedure requires that a subject weighing 50 kg exercise at a work rate of 450 kgm.min−1, you need to calculate the corresponding stepping rate for this subject:
-
stepping rate = 450 kgm.min−1 / (50 kg x 0.30 m)
-
= 25 steps.min−1
You can calculate the energy expenditure in METs using the ACSM metabolic equation for stepping exercise (see table below). The total gross VO2 is a function of step frequency, step height, and resting energy expenditure. The oxygen cost of the horizontal movement is approximately 0.2 ml.kg−1.m−1 for each four-count stepping cycle. The oxygen demand for stepping up is 1.8 ml.kg−1.m−1; approximately one-third more must be added (i.e. constant of 1.33 in the equation) to account for the oxygen cost of stepping down.

Nagle, Balke, and Naughton Maximal Step Test Protocol
Nagle, Balke, and Naughton (1965) developed a graded step test for evaluating work capacity. The subject should step at a rate of 30 steps.min−1 on an automatically adjustable bench (2–50 cm). The initial bench height should be set at 2 cm with an increase in height by 2 cm every minute of exercise. A metronome is used to establish the stepping cadence (four beats per stepping cycle). To determine a cadence of 30 steps.min−1, the metronome should be set at 120 (30 x 4). The test will be terminated when the subject is fatigued or can no longer maintain the specific stepping cadence.
Recumbent Stepper Maximal Exercise Test
Billinger, Tseng and Kluding (2008) devised a maximum exercise test using a total body recumbent stepper. This device has 10 settings ranging from 50 to 290 W. The procedure begins with the subject performing a 2-minute warm-up at a load setting of 1 (50 W). Directly after the warm-up, the preliminary workload is set to 4 (75 W), and the resistance is increased progressively until the subject reaches test termination criteria. A constant cadence (115 steps.min−1) is used throughout the exercise protocol.
In comparison to the treadmill testing (Bruce protocol), the recumbent stepper test produced a lower HRmax (181 vs. 188 bpm) and VO2 (3.13 vs. 3.67 L.min−1) on average. These changes are predictable given the seated posture during the recumbent stepper exercise test. The correlation coefficients for VO2max (r = 0.92) and HRmax (r = 0.96) indicated a strong relationship between the Bruce protocol and the recumbent stepper protocol. This testing modality may be valuable for evaluating the cardiorespiratory fitness of subjects with neuromuscular disorders that impair gait, coordination, and balance. Seated steppers are now commonly used as a training modality
Submaximal Exercise Tests


Single-stage and multistage submaximal exercise tests are easily accessible and will estimate individuals VO2max from heart rate measurements. It is important that assessors accurately record clients heart rates to increase the validity of the test. The most frequent method to gather data on the heart rate is via palpation of the carotid or radial pulse, however, the accuracy of this method is dependent on the experience and technique used by the assessor. The ACSM (2017) suggested that an electrocardiograph, heart rate monitor, or a stethoscope be used to determine the client's heart rate. The use of a heart rate monitor can reduce errors in the test. The submaximal heart rate response may be altered by several environmental, dietary, and behavioural factors. Therefore, these variables should be controlled to increase the validity of the test and can be used as a reference point in an individual’s exercise program. In addition, the test mode should be constant with the primary exercise modality used by the participant to address the specificity of training issues.
Cycle Ergometer Tests
The Astrand and Rhyming (1954 [Link]) cycle ergometer test is a single-stage test lasting for six a maximum of minutes. Astrand and Rhyming observed that when subjects were working at 50% VO2max their average heart rate was 128 beats per minute (bpm) for males and 138 bpm for females. If a female was working at a VO2 of 1.5 L.min-1 and her heart was 138 bpm then her VO2max was estimated to be 3.0 L.min-1. Astrand and Rhyming suggested work rate is based on sex and an individual’s fitness status:
-
men, unconditioned: 300 or 600 kg.m .min-1 (50 or 100 W)•
-
men, conditioned: 600 or 900 kg.m.min.1 (100 or 150 W)
-
women, unconditioned: 300 or 450 kg.m.min-1 (50 or 75 W)
-
women, conditioned: 450 or 600 kg.m.min-1 (75 or 100 W)
The pedal rate of the cycle ergometer is set at 50 rpm. The goal is to obtain heart rate values between 125-170 bpm, with a heart rate measured during the fifth and sixth minutes of work. The mean of the two heart rates is then used to determine the individuals VO2max from a nomogram (See Astrand and Ryhming, 1954). This value should be age-adjusted because heart rate maximum decreases with age by multiplying the VO2max value by the following correction factors in the table below (Astrand, 1960)

To estimate VO2max for this test, use the modified Astrand-Ryhming nomogram (see figure below). This nomogram estimates VO2max (in L.min−1) from submaximal treadmill, cycle ergometer, and step test data. For each test mode, the submaximal HR is plotted with either oxygen cost for treadmill exercise (VO2 in L.min−1), power output (kgm.min−1) for cycle ergometer exercise, or body weight (kg) for stepping exercise.
For the cycle ergometer test, plot the client’s power output (kgm.min−1) and the steady-state exercise HR in the corresponding columns of the Astrand-Ryhming nomogram. Connect these points with a ruler and read the estimated VO2max at the point where the line intersects the VO2max column.
Treadmill Tests
Traditionally the main exercise modality for submaximal exercise testing has been the cycle ergometer, although treadmills are now used in many settings. The same endpoint (70% heart rate reserve [HRR] or 85% of age-predicted HRmax) is used, and the stages of the test should be three minutes or longer to ensure a steady-state HR response at each stage. The heart rate values are inferred to age-predicted heart rate maximum, and VO2max is estimated using the formula below from the highest speed and/or grade that would have been achieved if the individual had worked to maximum (see table below).
Treadmill submaximal tests offer an appraisal of subjects functional cardiorespiratory capacity (VO2max) and assume a linear increase in HR with continuous increments in workload. Compared to subjects with low cardiorespiratory fitness levels, athletes probably are able to perform a greater quantity of work at a given submaximal HR. You can use treadmill maximal test protocols to detect the slope of the subjects HR response to exercise. The VO2max can be predicted from either one (single-stage model) or two (multistage model) submaximal heart rates. The accuracy of the single-stage model is comparable to that of the multistage model.
To estimate VO2max with the multistage model, use the HR and workload data from two or more submaximal stages of the treadmill test. It is important that the subject reaches steady-state HRs between 115 and 150 bpm (Golding, 2000). Determine the slope (i) by calculating the ratio of the difference between the two submaximal (SMax) workloads and the corresponding change in submaximal HRs:
-
i = (SMax2 − SMax1) / (HR2 − HR1)
Calculate the VO2 for each workload using the ACSM metabolic equation and use the following equation to predict VO2max:
-
VO2max = SMax2 + i(HRmax − HR2)
Single-Stage Treadmill Walking Test
Ebbeling et al. (1991) designed a single-stage treadmill walking test suitable for estimating VO2max of low-risk, healthy adults 20 to 59 years. The Ebbeling treadmill protocol also produced high test-retest reliability and validity with VO2max for a sample of middle-aged (45–65 years) women (Mitros et al. 2011). For this test, walking speed is personalised and ranges from 2.0 to 4.5 mph depending on the subjects age, gender, and fitness level. Establish a walking speed during a 4 minute warm-up at 0% gradient. The subjects warm-up bout should generate an HR within 50% to 70% of the individual’s age-predicted HRmax. The test consists of brisk walking at the designated pace for an additional 4 minutes at 5% gradient. Record the steady-state HR at this workload, and use it in the following equation to estimate VO2max in ml/kg/min:
-
VO2max = 15.1 + 21.8(speed in mph − 0.327(HR in bpm) − 0.263 (speed x age in years) + 0.00504(HR x age) + 5.48 (gender: female = 0; male = 1)
YMCA Cycle Ergometer Submaximal Exercise Test Protocol
The YMCA protocol (Golding 2000) is a submaximal cycle ergometer test for both males and females. This test uses three or four consecutive 3-minute workloads on the cycle ergometer devised to elevate the heart rate to between 110 bpm and 85% of the age-predicted HRmax for at least two consecutive workloads. The pedal rate is 50 rpm, and the initial workload is 150 kgm.min−1 (25 W). Using a friction type cycle ergometer, set the resistance to 0.5 kg (0.5 kg x 50 rpm x 6 m = 150 kgm.min−1).
For subjects to attain this work rate using a plate-loaded cycle ergometer, use one weight plate (1.0 kg) and reduce the pedalling frequency to 25 rpm (1.0 kg x 25 rpm x 6 m = 150 kgm.min−1). Use the heart rate (HR) during the last minute of the preliminary workload to determine subsequent workloads (see figure 4.9). If the HR is < 86 bpm, set the second workload at 600 kgm.min−1. If HR is 86 to 100, the workload is 450 kgm.min−1 for the second stage of the protocol. If the HR at the end of the first workload exceeds 100 bpm, set the second workload at 300 kgm.min−1.
The third and fourth workloads are set accordingly (see figure below). Measure the HR during the last 30 seconds of minutes 2 and 3 at each workload. If these HRs differ by more than 5 or 6 bpm, extend the workload an additional minute until the HR stabilises. If the client’s steady-state HR reaches or exceeds 85% of the age-predicted HRmax during the third workload, terminate the test. Calculate the energy expenditure for the last two workloads using the ACSM metabolic equations. To estimate VO2max from these data, use the equations for the multistage model to calculate the slope of the line depicting the HR response to the last two workloads.

Fox Single-Stage Cycle Ergometer Test Protocol
Fox (1973) designed a protocol to predict VO2max (ml.min−1). Have your client
perform a single workload (i.e. 900 kgm.min−1 or 150 W) for 5 min. To estimate VO2max, measure the HR at the end of the fifth minute of exercise (5HR) and use the following equation:
-
VO2max (ml.min−1) = 6300 − 19.26 (5HR)
Submaximal Step Tests
Step tests are also used to estimate VO2max. Astrand and Ryhming (1954) used a single-step height of 33 cm (13 in) for women and 40 cm (15.7 in) for men at a rate of 22.5 steps per minute. These tests require a VO2 of approximately 25.8 and 29.5 mL.kg-1.min-1. The Canadian Home Fitness Test has determined that such testing can be performed on a large scale and at a low cost (Link). Instead of estimating VO2max from HR responses to several submaximal work rates, a wide variety of step tests have been developed to categorise cardiorespiratory fitness established on an individual’s recovery heart rate following a standardised step test.
Astrand-Ryhming Step Test Protocol
As stated earlier the Astrand-Ryhming nomogram calculates VO2max from postexercise HR and body weight during bench stepping. For this test, the subject steps at a rate of 22.5 steps.min−1 for 5 minutes. The bench height is 33 cm for females and 40 cm for males. It is important to measure the postexercise HR by counting the number of beats between 15 and 30 sec directly after exercise. Correct the predicted VO2max from the nomogram if the subject is older or younger than 25 years.
Queens College Step Test Protocol
McArdle and colleagues (1972) devised a step test to predict VO2max with subjects stepping at a rate of 22 steps.min−1 (females) or 24 steps.min−1 (males) for 3 minutes. The bench height is 41.3 cm with the subject standing after the exercise. You should wait 5 seconds and then take a 15 second HR count.

Selection of VO2 tests
Below is a selection of established tests with correspondent links to the original studies.
-
Åstrand cycle test
[Åstrand, P.O. and Ryhming, I., 1954. A nomogram for calculation of aerobic capacity (physical fitness) from pulse rate during submaximal work. Journal of applied physiology, 7(2), pp.218-221. Link ]
-
Balke treadmill test
[Balke, B., 1963. A simple field test for the assessment of physical fitness. Civil Aeromedical Research Institute. Link ]
-
Bruce treadmill test
[Bruce RA, Kusumi F, Hosmer D (1973) Maximal oxygen intake and nomographic assessment of functional aerobic impairment in cardiovascular disease. Am Heart J 85:546–562. Abstract Link]
-
Conconi test
[Conconi, F., Ferrari, M., Ziglio, P.G., Droghetti, P.A.O.L.A. and Codeca, L.U.C.I.A.N.O., 1982. Determination of the anaerobic threshold by a noninvasive field test in runners. Journal of Applied Physiology, 52(4), pp.869-873. Link]
-
Cooper VO2max test
[Cooper, K.H., 1968. A means of assessing maximal oxygen intake: correlation between field and treadmill testing. Jama, 203(3), pp.201-204. Abstract Link]
-
Modified Harvard step test
[Ryhming, I., 1953. A modified Harvard step test for the evaluation of physical fitness. Arbeitsphysiologie, 15, pp.235-250. Abstract Link]
-
Canadian Home fitness test
Santo, A.S. and Golding, L.A., 2003. Predicting maximum oxygen uptake from a modified 3-minute step test. Research quarterly for exercise and sport, 74(1), pp.110-115. Link]
-
Multistage Fitness test [Bleep test]
[Léger L, Lambert J. A maximal multistage 20 m shuttle run test to predict VO2max. Eur J Appl Physiol Occup Physio 1982;49:1–12. Link]
-
Queens College step test
[McArdle WD, Katch FI, Pechar GS, Jacobson L, Ruck S. Reliability and interrelationships between maximal oxygen intake, physical work capacity and step-test scores in college women. Med Sci Sports 1972; 4 : 182-6. Abstract Link]
-
Rockport Fitness walking test
[Kline, C.J., Porcari, J.P., Hintermeister, R., Freedson, P.S., Ward, A., McCarron, R.F., Ross, J. and Rippe, J., 1987. Estimation of from a one-mile track walk, gender, age and body weight. Med. Sports Exerc, 19, pp.253-259. Link]
Muscular Strength

Muscular Strength
The assessment of muscular strength is fundamental to human performance. Muscular strength refers to the muscle’s ability to exert force, muscular endurance is the muscle’s ability to continue to perform successive exertions or many repetitions, and muscular power is the muscle’s ability to exert force per unit of time (i.e., rate). Accurate knowledge of an individual’s muscular strength levels is important for both occupational functional capacity assessment and applicable exercise prescription. Muscular strength and endurance are health-related fitness components that may improve or maintain the following):
-
Bone mass, which is associated with osteoporosis.
-
Glucose tolerance, which is relevant in both the pre-diabetic and diabetic state.
-
Musculotendinous conditioning, which is related to a reduced risk of injury including low back pain.
-
The ability to perform the activities of daily living, which is related to perceived quality of life and self-efficacy among other indicators of mental health and well-being.
-
The fat-free mass and resting metabolic rate, which is related to weight management.
Traditionally, tests allowing few (<3) repetitions of a task prior to reaching momentary muscular fatigue have been considered strength measures, whereas those in which numerous repetitions (>12) are performed prior to momentary muscular fatigue were considered measures of muscular endurance. However, the performance of a maximal repetition range (i.e., 4, 6, or 8 repetitions at a given resistance) also can be used to assess strength (ACSM, 2014).
The rationale for performing strength measurements
Performing muscular strength and muscular endurance tests prior to commencing exercise training can provide important information on an individuals baseline physical fitness level. For example, muscular fitness test results can be compared to established standards and can help to identify weaknesses or muscle imbalances that could be incorporated within the prescribed exercise programs. The information obtained during baseline muscular fitness assessments can also serve as a basis for designing client-centred exercise programs. Additionally, muscular testing can provide important feedback including progressive improvements made over time as a result of the exercise program, and thus fostering long-term exercise adherence.
Muscle Function Tests
There are very specific muscle function tests using specific equipment that assess the type of muscle action (i.e. concentric and eccentric), the velocity of muscle movement ( contraction speed) and range of motion at a joint. The outcomes of any test, however, are specific to the protocols and procedures used and there is no universal test that evaluates the total body muscular strength. Individuals must participate in familiarisation sessions with the testing equipment and adhere to testing protocols. This will increase the validity and generate a more reliable score that can assess the physiological adaptations over time. Furthermore, ensuring that standardised warm-ups are performed should proceed with muscular fitness testing. This may include five-to-10 minutes of light intensity aerobic activities, traditionally performed on a cycle ergometer or treadmill with a series of muscle preparation activities (stretching and light muscle repetitions of the soon to be engaged muscles). This physiologically will increase muscle temperature, stimulate the central nervous system and increase blood flow to the localised muscle. A summary of the standardised conditions include:
-
Correct posture
-
Consistent movement speed during each repetition performed
-
Full range of movement
-
Use of spotters
-
Equipment familiarisation
-
Warm-up
Traditionally, muscular strength refers to the external force (expressed in newtons, although kilograms and pounds are also used) that can be generated by a particular muscle or muscle group. Muscular strength can be assessed either statically (isometric strength) or dynamically. Isometric strength can be assessed using a variety of devices including cable tensiometres and handgrip dynamometers. Measures of static strength are specific to the muscle group and joint angle involved in testing and are commonly referred to as the maximum voluntary contraction (MVC).
The one-repetition maximum (1RM) test traditionally has been used to assess individuals maximum strength. This test assesses the individual's ability to lift the greatest resistance that they can move through the full ROM in a controlled manner with good posture. The 1RM test has been the standard for dynamic strength assessment. With appropriate testing familiarisation, 1RM is a reliable indicator of the individual's muscle strength (see links). A multiple RM, such as 4- or 8-RM, can also be used as a measure of muscular strength. For example, if an individual were training with 6-to 8-RM, the performance of a 6-RM to momentary muscular fatigue would provide an index of strength changes over time, independent of the true 1-RM. Reynolds et al. (2006) have demonstrated multiple repetition tests in the 4- to 8-RM range provide a reasonably accurate estimate of 1-RM.
However, a more conservative approach to assessing maximal muscle strength should be considered when working with individuals at high risk for cardiovascular disease, pulmonary, metabolic diseases and other health conditions. For these population groups, assessment of 10- to 15-RM that approximates training recommendations may be practical (Philips et al. 2004). Valid measures of general upper body strength include the 1RM values for bench press or shoulder press. Corresponding indices of lower body strength include 1RM values for the leg press or leg extension. The following represents the basic steps in 1RM (or any multiple RM) testing following familiarisation/practice sessions:
-
The subject should warm up by completing several submaximal repetitions of the specific exercise that will be used to determine the 1RM.
-
Determine the 1RM (or any multiple of 1-RM) within four trials with rest periods of 3–5 min between trials.
-
Select an initial weight that is within the subject’s perceived capacity (50%–70% of capacity).
-
Resistance is progressively increased by 2.5–20.0 kg until the subject cannot complete the selected repetition(s); all repetitions should be performed at the same speed of movement and ROM to instil consistency between trials.
-
The final weight lifted successfully is recorded as the absolute 1-RM or multiple RM.
Isokinetic Testing
Isokinetic testing involves the assessment of maximal muscle tension throughout a range of motion set at a constant angular velocity. Equipment that allows control of the speed of joint rotation as well as the ability to test movement around various joints is available commercially. Such devices evaluate peak rotational force or torque, but an important drawback is that this equipment is expensive compared to other strength testing modalities).
1RM Strength Prediction Equations
Table 2. Example studies with equations to predict % 1RM from repetitions

Table 3. Example studies with equations to predict 1RM from repetitions
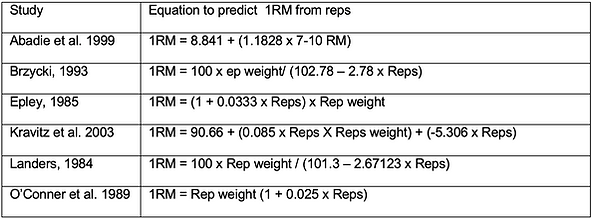
1RM Strength Tests, Reliability Studies & Equations
Below is a selection of established tests with correspondent links to the original studies.
-
Brzycki, M. (1993). Strength testing: Predicting a one-rep max from reps to fatigue. Journal of Physical Education, Recreation, and Dance, 68, 88–90. Link
-
Levinger, I, Goodman, C., Hare, D.L., Jerums, G., Toia, D. and Selig, S. (2009) The reliability of the 1RM strength test for untrained middle-aged individuals. J Sci Med Sport.12(2):310–6. Link
-
Phillips, W.T., Batterham, A.M., Valenzuela, J.E. and Burkett, L.N. (2004) Reliability of maximal strength testing in older adults. Arch Phys Med Rehabil. 85(2):329–34. Link
-
Reynolds, J.M., Gordon, T.J. and Robergs, R.A. (2006) Prediction of one repetition maximum strength from multiple repetition maximum testing and anthropometry. J Strength Cond Res. 20(3):584–92. Link
-
McCurdy, K., Langford, G.A., Cline, A.L., Doscher, M. and Hoff, R. (2004) The reliability of 1- and 3RM tests of unilateral strength in trained and untrained men and women. Journal of Sports Science and Medicine. 3, 190-196. Link
-
Nevill, A.M. and Atkinson, G. (1997) Assessing agreement between measurements recorded on a ratio scale in sports medicine and sports science. British Journal of Sports Medicine. 31, 314-318. Link
-
Tagesson, S.K. and Kvist, J. (2007) Intra- and interrater reliability of the establishment of one-repetition maximum on squat and seated knee extension. Journal of Strength and Conditioning Research. 21(3), 801-807. Link
-
Hoeger, W. W. K., Hopkins, D. R., Barette, S. L. and Hale, D. F. (1990) Relationship between repetitions and selected percentages of one repetition maximum: A comparison between untrained and trained males and females. Journal of Applied Sport Science Research. 4, 47-54. Link
-
Clarke, D.H. and Irving, R.N. (1960) Objective determination of resistance load for ten repetitions maximum for knee flexion exercise. Research Quarterly. American Association for Health, Physical Education and Recreation. 31(2), pp.131-135. Abstract Link
-
Landers, J. Maximum based on repetitions. National of Strength and Conditioning Association 1985, 6, 60-61. Link
-
Abadie, B.R. and Wentworth, M. (2000) Prediction of 1-RM strength from a 5–10 repetition submaximal strength test in college-aged females. J. Exerc. Physiol. [serial online] 3:1–5. Link
-
Ball, T.E. and Rose, K.S. (1992) A field test for predicting maximum bench press lift of college women. J. Appl. Sports Sci. Res. 5: 169–170. Link
-
Braith, R.W. Graves, J.E, Leggett, S.H. and Pollock, M.L. (1993) Effect of training on the relationship between maximal and submaximal strength. Med. Sci. Sports Exerc. 25:132–138. Link
-
Chapman, P.P. Whitehead, J. and Binkert, R. (1998) The 225-lb reps-to-fatigue test as a submaximal estimate of 1-RM bench press performance in college football players. J. Strength Cond. Res. 12:258–261. Link
-
Mayhew, J.L., Ball, T.E., Arnold, M. and Bowen, J. (1992) Relative muscular endurance performance as a predictor of bench press strength in college men and women. J. Appl. Sport Sci. Res. 6: 200–206. Link
-
Mayhew, J.L., Ball, T.E., Ward, T.E., Hart, C.L. and Arnold, M.(1991) Relationships of structural dimensions to bench press strength in college males. J. Sports Med. Phys. Fitness 31:135– 141. Link
-
Mayhew, J.L., Prinster, J.L., Ware, J.S. Zimmer, D.L., Arabas, J.R. and Benbem, M.G. (1995) Muscular endurance repetitions to predict bench press strength in men of different training levels. J. Sports Med. Phys. Fitness 35:108–113. 1995. Link
-
Kravitz, L., Akalan, C., Nowicki, K. and Kinzey, S.J. ( 2003) Prediction of 1 repetition maximum in high-school powerlifters. The Journal of Strength & Conditioning Research, 17(1), pp.167-172. Link
Muscular Endurance
Muscular endurance is the ability of a muscle group to perform repeated muscle actions over a period to produce muscular fatigue or to maintain a particular percentage of the 1RM for a sustained period of time (ACSM, 2014). If the total number of repetitions at a given amount of resistance is assessed, the result is termed absolute muscular endurance. If the number of repetitions completed at a percentage of the 1RM (e.g. 75%) is used pre and post-testing, the result is termed relative muscular endurance.
Field tests including the abdominal crunch test or the maximum number of push-ups that can be performed without rest may be used to appraise the endurance of the abdominal muscle groups and upper body muscles, respectively (see video of performed tests).
Resistance exercise equipment can be modified to evaluate individuals muscularly
endurance by choosing an appropriate submaximal level of resistance and determining the number of repetitions before fatigue. For example, the YMCA bench press test involves performing standardised repetitions at a rate of 30 reps.min-1. Men are assessed using a 36.3-kg barbell and women using a 15.9-kg barbell. Individuals are scored by the number of repetitions completed (Golding, 2000). The YMCA test is an example of a test that attempts maintain reliability by controlling the repetition duration and ensuring correct posture alignment. Normative data for the YMCA bench press test are presented below.

Credit: Live Like An Athlete [Canadian Crunch for muscular endurance]
Credit: University of Delaware Exercise Science [ACSM Push-Up Test]
Credit: Jimmy Nguyen [YMCA Bench Press Test]
TABLE 4. Fitness Categories for the Push-Up by Age and Sex
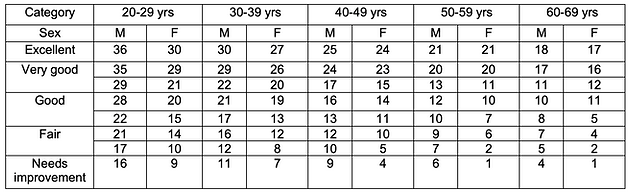
Adapted from Canadian Society for Exercise Physiology (2003)
TABLE 5. Fitness Categories for the Partial Curl-Up by Age and Sex

Adapted from Faulkner et al. (1989 [Link])
TABLE 6. Fitness Categories for the YMCA Bench Press Test (Total Lifts) by Age and Sex

Adapted from YMCA 2000 of the USA (2000)
Assessing Flexibility

Flexibility has been defined as the ability to move a joint through its complete range of motion (ACSM, 2014). Having good flexibility is important in athletic performance and for individuals to perform normal activities of daily living. Subsequently, maintaining the flexibility of all joints assists in skeletal movement. This is in contrast when a physical activity moves the structures of a joint past its full range of motion, tissue damage can ensue.
Flexibility is conditional on several specific variables including distensibility of the joint capsule, sufficient warm-up, and muscle viscosity. Additionally, compliance of various other tissues such as ligaments and tendons affects the range of motion (see stretch training page). It should be noted that flexibility is joint-specific; therefore, no single flexibility test can be applied to evaluate total body flexibility. Laboratory tests generally quantify flexibility in terms of the range of motion (expressed in degrees). Flexibility devices commonly used for include goniometers, electro-goniometers, the Leighton flexometer, inclinometers, and tape measures.
Estimates via instructor observations of a range of motion can be valuable in fitness screening but are imprecise comparative to directly measured range of motion. These estimates can include neck and trunk flexibility, hip flexibility, lower extremity flexibility, shoulder flexibility, and postural assessment. A more specific measurement of joint range of motion can be assessed at most anatomic joints following rigorous procedures using a goniometer. However, accurate goniometry measurements require in-depth knowledge of muscular-skeletal system anatomy and experience in performing the evaluation.
The most frequently used flexibility test used is the sit-and-reach test assesses low back and hamstring flexibility; however, its relationship to predict the incidence of low back pain is limited (Jackson et al. 1998 [Link]). The sit-and-reach test has been suggested to be a better gauge of hamstring flexibility than low back flexibility (Jackson and Baker, 1986 [Link]). The importance of adequate hamstring flexibility to activities of daily living and sports performance, therefore, supports the presence of the sit-and-reach test for health-related fitness testing until a criterion evaluation measure of low back flexibility is offered.
Although limb and torso length disparity may impact sit-and-reach scoring, modified testing that establishes an individual zero point for each participant has not enhanced the predictive index for low back flexibility or low back pain (Hoeger et al. 1990 [Link]).
Credit: Lone Star College-Kingwood (Goniometry for the Upper Extremity, Part 1)
Credit: Lone Star College-Kingwood (Goniometry for the Upper Extremity, Part 2)
Credit: University of Delaware Exercise Science (ACSM Sit and Reach Test)
Power

The evaluation of human performance is centred on the principle of specificity in which each component of fitness is independently examined. It is therefore essential to appreciate that this principle is founded on the conjecture that physical fitness attributes are not only distinct but are specifically responsive to training variable stimulus. Physical training often in the form of strength and conditioning seeks to address the distinctive conditions of the sport, assess and evaluate to improve performance. The concept of specificity is, however, complex when attempting to manage factors related to power production. The assessment of muscular power development is still one of the most debated areas of strength and conditioning.
Power production and the subsequent development is intersected with movement on a continuum from geriatrics to high-performance athletics. The examination of which accounts for neuromuscular nuances that are often disregarded in other measures of force production. Several authors regard power output capacity as the best index of coordinated human movement, chronic function or dysfunction (Puthoff and Nielsen 2007) or neuromuscular fatigue (Racinais et al. 2007). Other authors have also considered the effect manipulating other variables within the training that accommodates power development. Therefore, within sports science and also strength and conditioning it is important to acknowledge factors that influence power production and individuals explosive movement capacity. This can be achieved by evaluation, development and the refinement of training prescriptions.
Understanding the Mechanisms of Power Production
A large volume of research has been performed on the mechanisms of power output production. Unfortunately, attempting to convert the findings of empirical evidence towards sports performance has been challenging and also led to confusion regarding the practical application. There are various physiological attributes, intrinsic biomechanical factors, and external loading constraints that are involved in generating power through coordinated movements. Thus the term ‘maximal power’ has been defined by Cronin and Sleivert (2005) as the critical threshold interaction between strength and speed. However, this term is only true in the specific context for which it is being assessed. Depending on the methods used, muscular power is reported to be dependent on the following intrinsic physiological factors:
-
Availability of adenosine triphosphate stores within the particular muscles being examined
-
Ratio of fast fibres to slow fibres
-
Whole muscle volume or cross-sectional area
-
Muscle architecture
-
Intramuscular coordination and inter-muscular coordination
-
Coordinated timing and co-activation of antagonist musculature
-
Rate coding (i.e., axonal conduction velocity and stimulation frequency)
-
Stretch–shortening cycle (i.e., the active stretch of a muscle followed by an immediate shortening)
Considerations should also be given concerning the differences in body size when examining individuals powers changes over time. This is due to several sporting activities that are highly dependent on a fitness-to-body mass ratio. Many strength and conditioning professionals use the principle of specificity when generating test batteries and also for training prescriptions. However, the principle of specificity when applied to muscular power output is often complicated by various interrelated elements. Consequently, it may be prudent to consider the manifestation of power output as it is displayed through explosive movement, but also to isolate the particular underlying physiological characteristics that may prohibit or potentiate power adaptation. Power output should be assessed using a systematic approach that integrates multiple components associated with absolute force production, rate of force development, metabolic specificity, movement velocity, work capacity and body mass adjusted power.
Hill determined that muscle contracts at a velocity inversely proportional to the load. Many subsequent investigations have confirmed this physiological phenomenon within the isolated muscle, as well as within muscle groups during dynamic movement. A considerable volume of research has been devoted to examining the force-velocity relationship. This was formerly considered by Hill (1938; 1964) who examined skeletal muscles of frogs seeking to understand the characteristics of muscle contraction velocity and the magnitude of force production. Hill determined that muscle contracts at a velocity inversely proportional to the load. This, therefore, led to further investigation by others that confirmed this physiological phenomenon within isolated muscles and within muscle groups during dynamic movement.
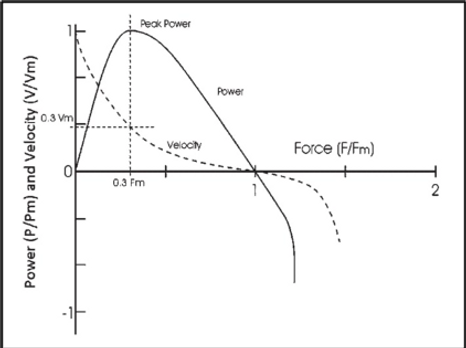
Figure 1. Force–velocity and power–velocity relationships.
The Hill-type model indicates that the maximal velocity of a given movement is dependant on the resistance applied to that movement (Figure 1 above). This is particularly true when we consider maximal voluntary muscular contraction against a high load generates slower velocities than maximal contractions against a light load. For example, during heavy resistance training individuals move heavy loads through a range of motion at slower velocities. At some stage along this continuum, the load may be great enough that the velocity reaches zero and an isometric contraction is produced. Furthermore, any applied force that generates movement is defined not only by the load encountered, but the velocity at which these actions take place. For every submaximal action, there is a distinct maximal velocity that can be generated. If we consider a trivial load then the potential velocity is maximised. Along the force-velocity curve of every muscle action and ensuing movement, there is a force-maximising load at which velocity is extremely low but the force is at its highest level. Additionally, along this curve, there is a point where the immediate product of force and velocity may be amplified.
This product is termed muscular peak power and is different from absolute strength and maximal movement speed. Figure …. shows the expression of peak power with the apex of the power-velocity curve. According to Newton’s Second Law of Motion, force is equal to the product of mass and acceleration (Force = mass x acceleration) of an object or body. For example, when a weightlifter applies force to the bar they must also offset the gravitational force elicited by the bar and the weights on it and also facilitate movement in the direction opposite to that of gradational force. Stone et al. (2000) define muscular strength as the maximal ability to generate force through a specific movement pattern, velocity, or rate of force production. Muscular strength and power are commonly used interchangeably; however, these attributes are different. For example, high force production can occur in the absence of movement, whereas muscular power cannot. Equally, dynamic muscle actions is an essential component of muscular power production this is because power is the manifestation of work achieved per unit of time. If we consider isometric voluntary contractions the force is very high, but power is zero due to no movement occurring, therefore, leading to no work being achieved. It is also important to consider that if an individual can increase power production capacity their muscles will be able to produce the same amount of work in less time or greater magnitude of work in the same time. Muscular power, therefore, is displayed by all muscle actions that produce a velocity. Cronin and Sleivert (2005) defined this as the rate of muscular force production throughout a range of motion.
Anaerobic Power
The phrase anaerobic power is frequently used interchangeably with maximal power; however, this term may better reflect the rate of adenosine triphosphate (ATP) use over a single (or multiple) maximal efforts against a submaximal load. It is important to understand that anaerobic activity ensues at the onset of exercise and is the accumulation of muscular work that is not attributable to aerobic metabolism. This “oxygen deficit,” which is manifested in the opening minutes of moderate- to high-intensity exercise, has been described since the early work of Krogh and Lindhard (1913). The anaerobic activity also ensues at relative intensities that exceed VO2max, thus requiring fuel sources that depend directly on exercise intensity. In this case, the anaerobic glycolytic and phosphocreatine systems contribute ATP at a much faster rate than is possible by aerobic pathways. The metabolic adjustment to this high rate of ATP turnover is that the glucose and glycogen energy sources used for anaerobic metabolism are limited and reduce significantly faster than during lower-intensity exercise. The depletion of energy substrate is acutely fast for higher-intensity activities fuelled by the phosphocreatine system.
Generally, any high-intensity anaerobic exercise that exceeds this time course occurs through the metabolic processes of the anaerobic glycolytic system, for up to approximately two minutes (see table 9.1). Beyond two minutes of exertion, additional work is progressively and incrementally fueled by the aerobic system. Glycogen, glucose, ATP, and phosphocreatine are the primary energy sources for anaerobic metabolism. Although they are available only in limited quantities, they are replenished rapidly following bouts of recovery (i.e., three to five minutes for ATP resynthesis, within eight minutes for creatine phosphate, and up to 24 hours for glycogen) (Friedman, Neufer, and Dohm 1991; Harris et al. 1976).
The relative intensity that individual works will determine when the onset of fatigue or muscular failure may occur. This can be after a single repletion or after six seconds when fuelled by the phosphocreatine system. Typically any high-intensity anaerobic exercise that exceeds this period occurs through the metabolic processes of the anaerobic glycolytic system, for up to two minutes. Beyond this period of exertion, any additional work is fuelled the aerobic pathway. Glycogen, glucose, ATP, and phosphocreatine are the main energy sources for anaerobic metabolism. These sources are available in limited quantities but are quickly replenished following bouts of recovery (i.e. three to five minutes for ATP resynthesis, within eight minutes for creatine phosphate, and up to 24 hours for glycogen) (Friedman, Neufer, and Dohm 1991)
Evaluating maximal anaerobic capacity is an important component of physiological testing. Anaerobic power output may be assessed on a continuum from instantaneous performance to power production across longer time periods. Thus, the term peak anaerobic power may define the greatest output or production of work per a specific quantity of time. Of the tests used to determine anaerobic power, the 30-second Wingate Anaerobic Test has been the gold standard assessment for power production capacity. This appeal is generally due to the ease of administration and its recognised validity and reliability (Bar-Or, 1987).
Immediate Maximal Power
Immediate maximal power may be defined as the highest potential power achievable in a single movement or repetition. This has also been termed as maximal power and has been termed as the greatest potential product of force production and velocity. Importantly maximal power is associated with the capacity of the neuromuscular system to develop a significant amount of force in a short period of time, this may be considered the essential component of performance in activities requiring maximal velocities with a constant load, particularly at the point of impact or release (e.g. jumping, kicking). Furthermore, this has been viewed by some as an important testing parameter and training objective in most strength and conditioning programs.
Findings demonstrate that maximal power is expressed at various percentages of peak force production, is largely contingent on the type of movement, and may range anywhere from 0% of maximal force production for the jump squat (i.e., no external additional load) (Cormie et al. 2007), to 80% of 1RM for the power clean (Cormie et al. 2007). Conversely, for isoinertial contractions (i.e., constant resistance), maximal power occurs at approximately 30% of maximal voluntary isometric contraction (Josephson 1993). Of particular relevance to lower extremity activity, body mass should be taken into account when measuring power output (i.e., added to, or considered a fraction of the load lifted).
A large volume of time has been devoted to the load-power relationship in lower body multi-joint movements including squats, Olympic cleans and the vertical jump. Cormie et al. (2007) demonstrated that maximal power is dependent on the type of movements and may range anywhere from 0% of maximal force production for the jump squat to 80% of 1RM for the power clean. Equally, Josephson (1993) demonstrated for isoinertial contractions that maximal power occurs at approximately 30% of maximal voluntary isometric contraction.
Rate of Force Development
The rate of force development (RFD) may be defined as the rate of rising in contractile force (or torque) at the onset of contraction (Aagaard et al. 2002). RFD is illustrated using the slope of the force-time curve (i.e., change in torque/change in time), as shown in figure 2. The peak rate of force production is the steepest point on the slope of the force-time curve and signifies the ability of a muscle (or group of muscles) to quickly produce force or tension. These elements are significant for coordinated movements that require rapid and forceful muscular contractions, such as sprinting and jumping. These activities require contractions in 50 milliseconds, which is shorter than required for maximal force production (i.e. > 500 ms) (Aagaard et al. 2002).
Athletes that develop an increase in RFD would improve their ability to generate force and lead to significantly higher absolute force production over the same time period (Aagaard et al. 2002). During conditions that do not permit maximal force or power production (i.e., extremely rapid eccentric or concentric muscle action), the athlete's capability to develop a high degree of muscle force in a short period may suggest superior performance (Suetta et al. 2004) as compared to absolute strength or power.

Figure 2. Rate of force development and moment–time curve.