
Understanding the Systematic Literature Review & Meta-Analysis Process

The Exercise Science Academy offers a full proofreading and editing service for SLR & meta-analytical research including (protocol development, Prospero registration, search strategy, screening process, quality assessment. risk of bias, tables of summary, data extraction, data analysis, PRISMA checklist, GRADE methodology, manuscript writing, journal selection, submission, and follow-up). If you, your organisation or company is interested in this service then please submit an enquiry below.
Overview of SLR & Meta-Analytical Research in Sports Science
Archibald Cochrane, a Scottish doctor, suggested in 1979 that “it is surely a great criticism of our profession that we have not organised a critical summary, by speciality or subspecialty, adapted periodically, of all relevant randomised controlled trials” (Cochrane, 1972). Cochrane was one of the founding fathers of evidence-based medicine. He highlighted the significance of critically summarising the results of research studies and selected the systematic review as a method of providing such a summary. The vision of Cochrane led to the Cochrane Collaboration in 1993, with the central purpose of developing systematic reviews based on the most robust evidence available concerning healthcare interventions.

Figure 1. Evidence-based practice pyramid and the hierarchy of evidence.
Since the 1990s, evidence-based medicine has acknowledged that a hierarchy of evidence exists and not all evidence is comparable. Evidence-based practice hierarchies rank study types based on the rigour of their research approaches. Studies that are situated at the top of the pyramid are considered the ‘gold standard and have used the ‘best available evidence for the specific researched area (Figure 1). Several versions of the evidence pyramid exist and have presented lower-level study designs at the bottom of the pyramid, and systematic reviews and meta-analyses placed at the top. A systematic review assembles all available studies associated with an area and reports and examines their results (Kang, 2015). During this procedure, study quality is assessed, and a statistical meta-analysis of the study results is performed. A meta-analysis can be defined as the statistical evaluation of a collection of analytic results that integrate the research findings (Glass, 1976). The aim of such an analysis, according to Whitehead and Whitehead (1991) is to obtain information that cannot be established from any study alone. A meta-analysis is a valid, objective, and systematic technique of analysing and combining results (Ahn and Kang, 2018).
Simply put a meta-analysis is a more structured approach to a traditional literature review that attempts to produce an objective measure of the overall benefit of the therapy approach (i.e. training frequency) being measured. Additionally, systematic reviews and meta-analyses usually proceed according to Figure 2.

Figure 2. Methodology for systematic reviews and meta-analyses.
A systematic review is a valid method of research that provides a summary report on a particular research question, using specific procedures to search, appraise, and synthesise the available literature systematically (Figure 2). Systematic reviews endeavour to assemble all accessible empirical research using clearly defined procedures to collect data on a specific research question. If identified studies have relevant data of the same topic (i.e. pre-vs post strength outcomes and training frequency) that can be pooled, a meta-analysis can be undertaken using data from only a few studies. However, it is a prerequisite for performing a meta-analysis that study selection via a systematic review is unambiguous with well-defined parameters.
Throughout the systematic review process, the quality of each study is considered, and statistical analysis of the study results is performed based on their quality (Ahn and Kang, 2018). This method is beneficial as it combines several separately performed studies, occasionally with different outcomes, and synthesises the results. Systematic reviews can also report on a series of outcomes from research on a particular area, and not just the results of one or two studies, providing clear summary findings of all studies addressing a specific research question. Moreover, systematic reviews can be used to determine whether study results are consistent and generalisable across different population groups (i.e. untrained or untrained), and treatment variations (e.g. one-vs three-sets per resistance exercise), or whether findings vary significantly by subgroup. Additionally, the methods used in a systematic review limits bias and increases the consistency and accuracy of the overall conclusions (Akobeng, 2005). For this reason, systematic reviews are regarded as the highest level of evidence in the hierarchy evidence-based pyramid that evaluates the effectiveness of treatment interventions (Akobeng, 2005).
Since 1999, several papers have provided guidelines for reporting systematic reviews and meta-analyses, including the Quality of Reporting of Meta-analyses (QUORUM) statement (Moher et al., 2000) and the development of registers including the Cochrane Library’s methodology register. Additionally, in 2009 the Preferred Reporting Items for Systematic Reviews and Meta-Analyses (PRISMA) statement (Liberati et al., 2009) further improved the standardisation of systematic reviews and meta-analyses (Willis and Quigley, 2011). Systematic reviews and meta-analyses commonly proceed according to Figure 2. Each of the stages required to complete a systematic review and meta-analysis will be explained below.
Devising the research question
Like all academic research reports, the research question should be clearly stated from the onset. It is essential in evidence-based research that the Population, Intervention, Comparison, Outcome measure and Timeframe (PICOT) framework (Table 1) are specified and adhered to (Thabane et al., 2009). To aid in the development of the meta-analysis, a formal written protocol, using the structure provided by the PRISMA guidelines, should be followed. This protocol ensures that the researchers adhere to a predetermined process and safeguards transparency. Additionally, this structured protocol with a description of the study methodology is valuable during a long and complex review and analysis. Failure to produce a well-structured protocol may detract from the rigour of the study and could leave the researcher disorganised further down the line when the primary aims and methods of the study become vague. Once the study protocol is produced it is suggested that the review be registered with PROSPERO ( http://www.crd.york.ac.uk/prospero/ search.asp) to ensure transparency.
Table 1. The PICO and PICOT framework for the development of a research question for a systematic review.
Defining inclusion and exclusion criteria
The validity of any systematic review or meta-analysis is dependent on the strength of the included studies. Defined inclusion and exclusion criteria set the restrictions for the systematic review. They are determined after setting the research question which is frequently performed before the literature search; however, scoping searches may need to be undertaken to determine appropriate conditions.
Table 2. Considerations towards determining selection inclusion and exclusion criteria.
Several different factors can be used as inclusion or exclusion criteria (Table 2). This information regarding inclusion and exclusion criteria is normally reported as a paragraph or table within the methods section of the systematic review. Authors should clearly state the type of studies (i.e. randomised control trials, non-randomised control trials, or controlled trials) that are included in the review. This allows the reader to make an informed assessment as to whether the studies have an appropriate research design that addresses the research question. Within the inclusion and exclusion criteria, information necessary include the study design (e.g. randomised control trial [RCT]), subject’s characteristics (e.g. trained or untrained), publication status (e.g. unpublished or published), language used (e.g. English only), and research duration. If there is any inconsistency between the number of subjects included within the original study and the number included in the analysis, this should be clarified to avoid confusing the reader.
Literature search and study selection
To maintain an appropriate foundation for evidence-based research, it is critical that an extensive search of the literature is performed that identifies and includes as many studies as possible that meet the inclusion criteria. A complete literature search process must be recorded and documented, with special attention being paid to the methods used to collect the study data for the analysis. Key terms and synonyms relative to the research question are used to identify studies for inclusion in the review (i.e. ‘resistance training loading’, ‘muscle strength’, ‘training intensity’, ‘strength training loading’, and ‘resistance training intensity). Also, an extensive literature search aims to reduce publication bias, which occurs when studies with statistically significant results are more inclined to be cited and are published in English language journals. There is evidence that demonstrates that only performing single electronic database searches lack sensitivity and may exclude relevant articles. Dickersin, Scherer, and Lefebvre (1994) reported that when performing searches using a single electronic database (MEDLINE), only 30-to-80% of studies were identified from all known published randomised controlled trials.
It is, therefore, critical to perform searches using multiple databases to ensure as many studies are identified, reducing selection bias. Four electronic databases PubMed, MEDLINE, EMBASE, and SPORTDiscusTM, are frequently used to identify relevant articles. Other sources used to extract studies include dissertations, theses, and the cross-referencing of previous systematic reviews and meta-analyses as this reduces the likelihood of missing related articles.
Once relevant studies have been identified and retrieved, it is essential that any duplicate studies are removed. This is followed by the screening of studies at abstract level that meets the pre-set inclusion criteria, and then the final selection of studies based on full-text screening. It is essential to maintain impartial during this procedure, and at least two investigators should be independently involved. Furthermore, the inclusion of the publication data, publication format (i.e. journals, conference articles), or language restriction in the search strategy should be stated within the review (Higgins and Green, 2011).
Abstract and full-text screening
Once the literature search has been performed, the list of retrieved abstracts is examined for eligibility and inclusion within the review. Abstract screening is conducted using a-prior selection form that contains the inclusion and exclusion criteria for each PICO or PICOT element (Schardt et al., 2007). A minimum of two independent reviewers should perform an abstract examination with combined literature results screened for disagreement. A third reviewer may be consulted if there is a disagreement between reviewers and a consensus reached between all reviewers on study inclusion. Following the same principles as the abstract screening procedure is the full-text evaluation. However, full-text screening involves the final decision to include or exclude studies. Additionally, excluded studies must be tracked, and the reason for exclusion should be stated. Once the selection is completed, the final number of included and excluded studies is reported in the PRISMA flow diagram (Figure 3).
Explanation of the individual items in the PRISMA study flow diagram
The PRISMA flow diagram is the most commonly used method to report the process of retrieving articles of relevance (Figure 3). The first item within the flow diagram is the records identified through database searching (i.e. PubMed, MEDLINE and SportDiscus). This shows the number of publications detected in each database based on the selection criteria. The item, ‘additional titles identified through cross-referencing’ refers to the number of publications found in information sources other than those online (e.g. research reports, Master thesis, PhD thesis, and handbooks). Another step is the removal of duplicate articles that occur when working with multiple databases. Such duplicates should be identified and removed. The next stage in the process is the item, ‘records identified and screened’ which specifies the number of studies that remain after publication rejections and removal of duplicates after the abstracts have been read. The number of articles excluded based on the abstract or full-text examination is indicated in the excluded box. The last item reports the final number of articles in the study.

Figure 3. Example of PRISMA flowchart.
Assessing the quality of evidence
The outcomes of a systematic review critically depend on authors’ judgments relating to which studies are included and on decisions relating to which study data are presented and analysed. It is paramount that the methods applied must be transparent to minimise bias and human error. Therefore, the quality of the systematic review or meta-analysis is conditional to the quality of evidence provided in the retrieved studies. If the evidence contained in the included studies is low, the quality of the meta-analysis is reduced and can lead to inaccurate reporting of critical outcomes (Guyatt et al., 2008).
Several tools can aid as a guide when assessing study methodologies and results. These include the Consolidated Standards of Reporting Trials (CONSORT) statement, which
provides a standardised method of reporting and interpreting the results of RCTs (Schulz et al., 2010). This method comprises a 25-item checklist that contains questions on trial design, data analysed, and the interpretation of results. For a more quantitative analysis of study design, the Grades of Recommendation, Assessment, Development, and Evaluation (GRADE) working group may be used (Atkins et al., 2004). These recommendations contain a point system that can be used in combination with the CONSORT statement to further differentiate among studies.
The Physiotherapy Evidence Database (PEDro) scale (Verhagen et al., 1998; Maher et al., 2003; Moher et al., 2009) has been suggested to be a valid assessment tool for examining the
methodological quality of randomised trials (Elkins et al., 2013). The PEDro scale has 11 criteria, with a maximum score of ten. The ten items (Table 3) contribute to a summary score where five or six typically define acceptable study quality (Da Costa, Hilfiker and Egger, 2013). Most items within the PEDro scale relate to study design biases, but others relate to study reporting, for example, whether 95% confidence intervals or other measures of variability were included.
Table 3. The Physiotherapy Evidence Database (PEDro) scale.
Data extraction
Data extraction is the method by which researchers obtain the required information about study characteristics and findings from the included studies. This needs to be unbiased and reliable, preferably with two researchers independently performing the data extraction (the level of inter-rater agreement). Considerations should be made by the investigators due to the variances in size and design of each study, and slight alterations may be necessary when pooling the data (Egger, Schneider and Smith, 1998). If there are issues regarding the variances in size and design of the outcome variables when pooling the data (i.e. different evaluation instruments), then the analysis may be restricted to a systematic review. Where differences between reviewers occur, then further consultations and settlements are made by consensus or by a third reviewer (Buscemi et al., 2006).
Each trial contributing data to the meta-analysis as detailed earlier must be critically appraised to determine if the study was conducted reliably and if there was any risk of bias (Pannucci and Wilkins, 2010). For example, was the study randomised, were there excessive attrition, and was the results reported consistently. The Cochrane database and the review manager (RevMan) provide a risk of bias tool that allows these aspects to be recorded and presented (Table 4). As specified by the Cochrane Collaboration, the emphasis should be on the evaluation of internal validity of the study results. This should be narrated as low, unclear, or high risk of bias for each study. Lastly, the outcome data of interest should be extracted for analysis.
Table 4. Cochrane collaborations tool for assessing the risk of bias in randomised trials (adapted from Higgins et al., 2011).
Overview of the methodology for analysing study data
Following a systematic review, data from each separate study are extracted and re-analysed using recognised statistical meta-analytical procedures. The use of a meta-analysis as a method for quantitative research synthesis of multiple studies has grown in popularity since Glass introduced the term in 1976. This may have been a new term, but the concept of statistical integration previously existed (e.g. Pearson, 1904; Tippett, 1931). Glass (1976) devised numerous statistical terms for synthesising the results of more than one study, including primary and secondary analysis. These concepts of the meta-analysis discussed primary analysis as the examination performed in an original study and secondary analysis as the use of the statistics to find answers to new problems. Glass (1976) coined the phrase for a meta-analysis as the analysis of analyses (Shelby and Vaske, 2008). However, meta-analysis can be defined in several ways and intriguingly no universally accepted definition on how to perform a meta-analysis exists (Shelby and Vaske, 2008).
The meta-analytical method varies from other quantitative reviews that attempt to examine the correctness of hypotheses (Little, Corcoran and Pillai, 2008). Meta-analysis is a method of performing statistical analysis of research findings of several independent studies using numerous quantitative approaches and calculation formulas when compiling multiple research findings (Cooper, 1982; Cooper and Hedges, 1994). It is essential that any researcher that performs a meta-analysis has familiarity with the main concepts in which the correct results can be obtained. Meta-analysis is generally performed using a two-stage procedure (Deeks, Altman and Bradburn, 2001). The first stage involves the evaluation of the direction of effect, size of the effect, homogeneity of effects between studies, and strength of evidence (Higgins, Altman and Sterne, 2011). Subsequently, the extracted data are evaluated both quantitatively and qualitatively. If the different research outcomes cannot be pooled, then all results and characteristics of each study should be presented in a table. However, if the outcome results of at least two separate studies can be combined, then the weighted pooled estimate for the interventions is calculated.
Effect size
The primary method of the meta-analysis is to determine a summary effect size (ES) by synthesising data from multiple studies (Hedges and Olkin, 1985; Rosnow, Rosenthal and Rubin, 2000). The ES also is known as the treatment of effect or application effect is a simple method used to measure the strength and direction of the relationship between two groups (Little, Corcoran and Pillai, 2008). The ES is commonly unit free and is therefore easy to compare across variables that are measured on different scales. The ES calculations frequently fall into three categories: (1) proportions, (2) averages, and (3) correlation coefficients.
The specific summarising statistic used within the meta-analysis is dependent on the research findings, the category of statistics reported for each study, and the hypotheses tested by the meta-analysis (Lipsey and Wilson, 2001). Due to the calculations required for meta-analyses, three formulas are frequently used (Cohen’s d, Pearson’s r, and odds-ratios). Table 5 shows several standard ES statistics, the formulas necessary for computing the study level ES, and their individual use for the meta-analysis. For example, in this thesis, Cohen’s d formula is used to examine the difference between means of two or more groups of respondents in each study (i.e. low weekly training frequency vs high training frequency). For more detailed information on individual ES used in the meta-analysis, see Cooper and Hedges (1994).
Three variables are required to calculate the summary ES. An ES statistic, the SE of the ES, and the inverse variance of the SE are computed for each study. ES established on larger samples offers better population estimates than smaller samples (Lipsey and Wilson, 2001). Researchers normally weigh each ES for each study to account for sample size differences. Hedges and Olkin (1985) showed that optimal weights are founded on the SE of the ES. This is because a larger SE corresponds to a less precise ES; the actual weights are calculated as the inverse of the square SE minus the inverse variance weight (Lipsey and Wilson, 2001).
Table 5. Commonly used effect sizes for meta-analysis.

Types of outcome measure
The type of data that is used to compare the outcome of interest is important to understand. The choice of the measure of treatment or other effect depends on the type of outcome variable used in the study. In data analysis, outcome variables are typically categorised as dichotomous (e.g. mortality or the number of infections) or continuous (e.g. weight loss, blood pressure, strength gain).
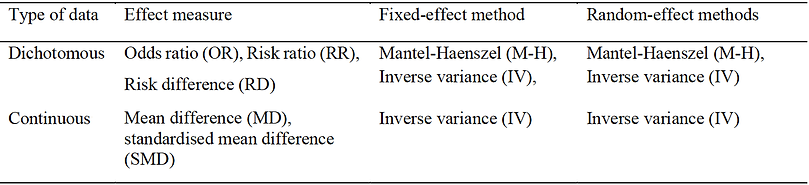
Table 6. Summary of meta-analysis methods.
Dichotomous variables
Dichotomous variables are categorical variables that take one of two possible values when measured (Lewis-Beck, Bryman and Liao, 2004). The value is most often a representation for a measured variable (e.g., under 45 years or over 55 years) or an attribute (e.g., gender- male or female). For meta-analyses with dichotomous (binary) data, calculation of the logarithm (log) of the odds ratio (OR) or the log of risk difference (RD), or the risk ratio (RR) from each study may be used or the number of events and the total number of subjects for each group (Table 6). OR can be computed for any study design with RR and RD used to calculate any randomised control study (RCT) or quasi-experimental study or cohort studies. Fleiss (1994) examined the statistical properties of the OR and concluded that the OR is the preferred ES for the computation phase of the meta-analysis of binary data irrespective of the study design of the studies.
Continuous variables
When pooling data from continuous variables (as in this thesis), the mean difference (MD) and standardised mean difference (SMD) are applied (Table 6). Considerations are also needed when determining what effect measure to apply. When study results are displayed in the same units, then MD can be applied. However, if different units of measurement are presented, then SMD should be applied. The MD is the absolute difference in mean values between groups, whereas SMD is the mean difference between groups divided by the standard deviation. If there is a reported value of ‘0’ for either MD or SMD, it suggests that the effects of the intervention and the control treatment are equivalent. For example, in Figure 4, the value is higher than ‘0’ and indicates that the treatment method (high weekly set training) is more effective than
low weekly set training.
Fixed-effect models or random-effect models
There are two types of models that can be applied (fixed-effect or a random-effect model) to examine the ES. In a fixed-effect model, it is assumed that the treatment effect is the same and that variances between study outcomes are due to random error. Consequently, a fixed-effect model can be applied when variability in outcomes within a study is small or that the included studies have the same design and research methodology. There are three commonly applied methods used for weighted estimation in a fixed-effect model: (1) inverse variance-weighted estimation (Moher et al., 1999); (2) Mantel-Haenszel estimation (Liberati et al., 2009); and (3) Peto estimation (Willis and Quigley, 2011). Whereas random-effect models are applied when studies are considered different, even if a heterogeneity test does not report a significant result. Therefore, differences in variation among studies are assumed to be due to not only random error but also between-study variability. Within this thesis, weighted estimation using a random-effect model method is applied with the inverse variance-weighted estimate used due to treatments being continuous variables.
Assessing heterogeneity
To assess whether the ES calculated from several studies is similar, a homogeneity test should be performed. A homogeneity test determines whether the degree of heterogeneity is greater than would be predicted to occur when the ES calculated from several studies is higher than the sampling error. Three types of homogeneity tests will be discussed ; Cochrane’s Q test (chi-squared), Higgins I2 statistic and Tau-squared (Tau2). For Cochrane’s Q statistic, when the P-value of the chi-squared test (calculated from the forest plot) is less than 0.1, it can denote statistical heterogeneity, and a random-effect can be applied and I2 statistic (Higgins et al., 2003). The Higgins I2 statistic, as illustrated in Figure 4.4 (I2 = 51%), generates a value of between 0 and 100%. A value of < 25% is considered to display strong homogeneity, a value of 50% is moderate and values > 75% indicates strong heterogeneity. A random-effect model should be applied if heterogeneity is displayed and a subgroup analysis or a meta-regression analysis is performed. This should be predetermined and pre-planned before commencing with the meta-analysis. In a random-effects meta-analysis, the degree of variation among the effects detected in different studies (between-study variance) is referred to a Tau2 (Deeks, Altman and Bradburn, 2001). If Tau2 is greater than 0, there is a variation in the true ES.
Assessment of publication bias
Publication bias is the most common type of reporting bias found in meta-analyses. This refers to the misrepresentation of meta-analytical outcomes due to the greater probability of publication of statistically significant studies rather than non-significant studies. The Galbraith plot can be used as a method that examines heterogeneity (Figure 4) and as an alternative or in conjunction with forest plots. The Galbraith plot is a graphical representation of the study data and is designed to assess the degree of heterogeneity between studies in a meta-analysis. For example, in Figure 4, each study is denoted as a circle, with a regression line running
centrally through the plot. Parallel to this line is two dotted lines that are positioned two standard deviation distance apart that create an interval in which the circles (studies) would be estimated to fall between if the studies were estimating a single fixed parameter.
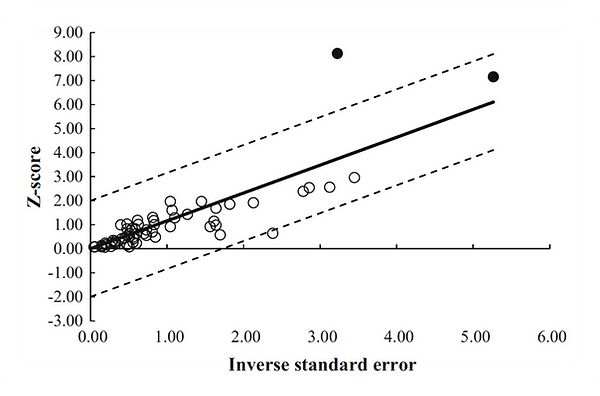
Figure 4. Galbraith plot was used to examine study heterogeneity (pre- vs post-intervention strength change). Each open circle represents one pre- vs post-intervention study datum.
Another frequently used test to assess reporting bias is the funnel plot. Initially introduced by Light and Pillemer (1985) the funnel plot is used as a measure for ES on the x-axis and a measure related to the within-study variance on the y-axis. Each study is signified by a circle and is scattered around the summary estimate. This produces a funnel type distribution of circles in the plot that without publication bias is assumed to be symmetrical. If studies are positioned on one side more than the other, subsequent asymmetry may be attributed to publication bias. However, due to the construct of the funnel plots asymmetry can be caused by more than publication bias (Sterne, Gavaghan and Egger, 2000). Lau and colleagues (2006) noted that interpretations of funnel plots might be different depending on each reader, and not everyone can visually identify publication bias from funnel plots.
Similar to funnel plots is the trim and fill plot (Duval and Tweedie, 2000). This plot displays the results of the imputation algorithm (termed trim and fill) and is not just a depiction of raw data. The algorithm analytically measures the symmetry of the plot and imputes new studies to plot in the event of studies appearing to be omitted. This, therefore, changes the meta-analysis summary estimate, possibly causing asymmetry. The plots appearance is like a regular funnel plot but includes additional imputed circles (typically not filled), indicating the imputed studies and a vertical line that signifies the summary effect when these studies are included in the meta-analysis. The number of imputed studies, specifically the variance between the original summary estimate and the newly generated summary estimate (after imputation) might indicate publication bias. Other plots include the Egger regression asymmetry plot (Egger et al., 1997). This plot is fundamentally a Galbraith plot with the plotting of the regression line between the intervention effect estimates on their standard error (Egger et al., 1997).
Presentation and reporting of results
Meta-analyses reporting follow a coherent pattern with the number of citations initially screened and the results of the screening process narrated in the text and presented in a flow diagram. Then, each included studies necessary elements are reported in a table (i.e. subjects age, training status, weight). After this, the quality of studies should be reported in a further table. Secondly, a table presents the relative quality of evidence, such as a PEDro scale (Table 3). This is followed by the results of the data analysis, as presented in a forest plot and funnel plot.
Forest plots
The forest plot is the most frequently presented graph in meta-analysis reports. It displays the estimate and 95% CI for each study and the corresponding summary estimate. Forest plots are suitable for demonstrating how the effect estimates for separate studies are pooled to report the meta-analysis results. The pooled estimate is the outcome of the meta-analysis and is detailed using a forest plot (Figure 5). The forest plot displays data that was entered from each study that is in the meta-analysis. Figure 5 illustrates the results of studies that have been pooled. The names of the study authors of the primary studies are located on the left-hand side. The green squares indicate estimates of the individual studies and the horizontal line indicates 95% CI. The area of the green square reflects the weight each study contributes to the meta-analysis. The 95% CI would contain the primary effect in 95% of the occasions if the study were repeated. The solid vertical line corresponds to no effect of treatment, and rhombus indicates the meta-analytically pooled estimates 95% CI.

Figure 5. An example of a forest plot of low weekly sets vs high weekly sets on multi-joint and single-joint exercise by study.
In Figure 5 Review Manager software (RevMan) was applied for the analysis with two types of P-values being specified. The first P-value is from chi-squared (Chi2), which evaluates the null hypothesis for lack of heterogeneity (Figure 5, P = 0.04). The second P-value is from the Z-test, which assesses whether the intervention has no effect (the null hypothesis). The most important statistic to report is the results of the Z-scores P-value (Figure 5, P = 0.02). The Z-score is a test of statistical significance that helps decide whether to reject the null hypothesis. When evaluating the statistical significance of a meta-analysis, a P-value < 0.05 can be explained as having a significant difference in the effects of the two treatments.
Summary
When performing a systematic review and meta-analysis, it is essential to ensure that the quality of studies is accurately assessed. If not evaluated accurately or if the incorrect methodology is applied, then the results may be biased, therefore, nullifying the outcomes. Conversely, when a systematic review and meta-analysis is correctly applied, they can generate meaningful results that could only be attained using large-scale randomised control trials which are challenging to perform in individual studies. As our understanding and appreciation towards evidence-based practice progress, the number of systematic reviews and meta-analyses will further increase. However, it is important to ensure that results presented in any meta-analyses be critically validated as indiscriminate acceptance of results can be dangerous andmisleading.